Hugo A. Sanchez recently won a gold medal for data wrangling in the Visual.ly Olympics for his London 2012 Olympic Venues Series. His work incorporates spatial information, building component counts, dimensions, colors, textures, and more, that all have to be manually created in a 3D modeler.
The Idea
The Olympics are the perfect opportunity to experiment with integrating the 3D modeling process into the infographic creation process. It is not something new, I didn’t discover it, but who cares? Working in 3D offers fantastic possibilities. My goal is to produce images as close as possible to reality, so that the result speaks for itself. The reader can travel around the graphics, exploring every small detail of the buildings that the TV broadcast only showed for short periods of time in the background of other activities. 
The Process
Data Research The first two or three days are filled completely with research. I try to get as much information as possible, from reliable sources. Up-to-date images are very important because in a project like the Olympics facilities, they only finished important details at the very last moment. But there is something most important, the holy grail of information: THE OFFICIAL BLUEPRINTS. Official drawings save lots of time and, more importantly, they make it possible to add plenty of detail. Construction drawings are also the most difficult to get if you are not involved directly in the project. The common excuse is for security reasons or confidentiality. Architectural blogs and forums are the first places I go to when searching for the plans.  Data Analysis Once I’m comfortable with the obtained information, I like to take some time to learn the construction inside and out. I try to understand the shapes involved to determine the modeling techniques I’ll be using. I constantly find challenges in this phase. I analyze the blueprints and the reference pictures, looking for interesting elements for a detailed explanation.
  The Learning Never Stops I like to start projects with the most difficult tasks because sometimes at the beginning, I don’t know how to resolve them. Working in this order has a bright side: you always finish the projects with a new trick to keep up your sleeves for impressing friends or clients. Detail Freak! With a good model, you can do whatever you want; rotate it, cut it, disarm it, change the ilumination, set dozens of cameras etc. That’s why in the modeling stage, I love to create a model that is as detailed as possible. I cannot think in a set-camera position: showing detail in only one portion of the construction spoils a lot of possibilities! If I change my mind (it happens a lot!) and choose a different angle, the final rendering still needs to be detailed.
  I try to follow a basic rule for modeling: make it clean and simple. I avoid modeling the complex elements, like organic forms, with millions of polygons. These forms slow the scene down during the modeling process. I analyze the building and think about which modeling technique will be the most effective to get an accurate but fast result.
  The next step is the texturing process. I try to obtain textures as close as posible to the real ones. Photoshop is my main tool of choice in this stage. I blend multiple texture maps together to obtain the most accurate results. Last, but not least, comes THE LIGHTING. For me, this is one of the most important stages in the project. The challenge here is similar to the modeling: avoid using hundreds of lights for illuminating the scene. More lights mean more render time so it’s very important to obtain results with less. The lighting is a very thin line that separates masterful results from crappy ones. And finally… After I finish all the models, I develop a list of the topics that I’ll develop for the infographic and the sketching process begins. Once I like one idea, I can produce some low-res renders to make an advanced sketch with real information. In most of the cases, I write the information that belongs to the infographic and a reporter writes the story. When everything is perfect and clear, I shoot the final renders. The final renders always take time, so it is important to include the render time as part of the complete process. I deliver the final work three or four hours in advance so that any possible problem in the production area could be detected and resolved in time to meet the deadline. In this kind of project, it is crucial to maintain the confidence of the directors and editors, this way, they will support your ideas, your work and they will provide the space in their sections to publish it.


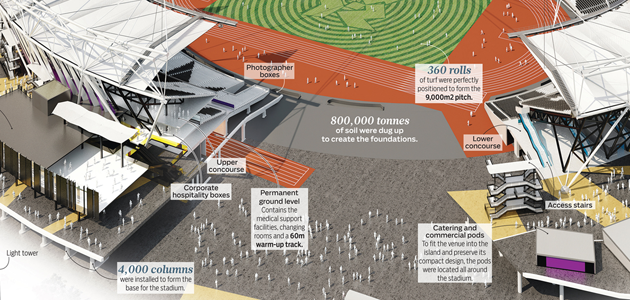
The full Olympic Venues Series
Olympic Park Aquatics Center Basketball Arena Velodrome Copper Box Olympic Stadium Hugo A. Sanchez is from Mexico City and is a recent Dubai, UAE transplant. He’s working as a Graphic Artist for a newspaper called Gulf News.