Mapping The Internet

See what 1400+ marketers had to say about the top marketing trends for 2024.

The internet is a worldwide network of computers, but it seems very intangible to most of us. In a general sense, the internet is made up of a lot of different components: Websites, users, servers, browsers, networking cables, and more. Some of these things have a physical component, and some of them do not, but even the ones that do have a physical component can be hard to conceptualize spatially. These maps help to lend that spatial component to the Internet.

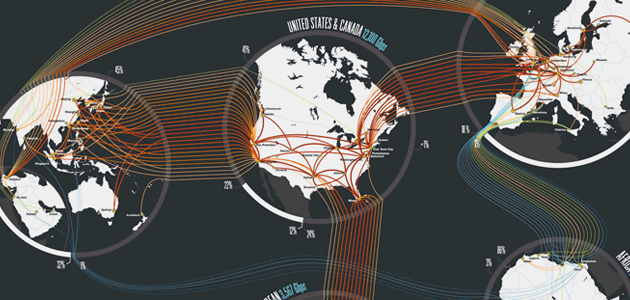
  1. The backbone of the internet is the cables that connect everything. Underwater cables provide many of the connections between continents.
    Submarine Cable Map

    Explore more infographics like this one on the web’s largest information design community – Visually.


  2. And the capacity of those cables is important. The 2011 Global Internet Map shows what the capacity is, and how much of it is being used.
    TeleGeography

    Explore more infographics like this one on the web’s largest information design community – Visually.


  3. But not all of those cables are used at the same time. Animated Internet Census 2012 shows what regions use the internet as the day sweeps the globe.
    Animated Internet Census 2012

    Explore more infographics like this one on the web’s largest information design community – Visually.


  4. Another critical component to the Internet is how we access most of it. Web browser market share varies from place to place, but can all still be mapped.
    World Web Browser Market Share

    by katharinemorgan.
    Explore more infographics like this one on the web’s largest information design community – Visually.


  5. The languages of the internet dictate who can understand what portions of it. Top languages on the Internet shows which regions are dominated by which language.
    Top Languages on the Internet

    Explore more infographics like this one on the web’s largest information design community – Visually.


  6. Twitter follows similar language distributions. The Language Communities of Twitter shows what language geotagged tweets are written in.
    Language Communities of Twitter

    Explore more infographics like this one on the web’s largest information design community – Visually.


  7. For a broader look at the Internet, check out The Internet Map.
    The Internet Map

    Explore more infographics like this one on the web’s largest information design community – Visually.


  8. The Internet Super Subway imagines the internet as if it were a transit system.
    How The Internet Would Look Like As A Subway

    Explore more infographics like this one on the web’s largest information design community – Visually.


  9. Many internet communities and websites have a geographic component. A huge portion of Wikipedia’s content can be mapped.
    Mapping Wikipedia

    Explore more infographics like this one on the web’s largest information design community – Visually.


  10. Craigslist covers different regions of the country, all mapped out in the United Zipcodes of Craigslist.
    United Zipcodes of Craigslist

    by johnmnelson.
    Explore more infographics like this one on the web’s largest information design community – Visually.


  11. And many tweets are geolocated. This means those tweets can all be put on a map, making their geographic density visible.
    Tweetping

    Explore more infographics like this one on the web’s largest information design community – Visually.


  12. Reddit may not have geolocated content, but the subreddits themselves all have relationships that can be conceptualized spatially. The Map of Redditland is one attempt at showing those relationships.
    Map of Redditland

    Explore more infographics like this one on the web’s largest information design community – Visually.


The internet is a complex set of systems, and maps of all types can help get a handle on how they all come together.   Drew Skau is Visualization Architect at Visual.ly and a PhD Computer Science Visualization student at UNCC with an undergraduate degree in Architecture. You can follow him on twitter @SeeingStructure

Share
facebook
linkedin
twitter
mail

2024 State of Marketing Report

Your golden ticket to crush your goals with data-driven insights!

2024 State of Marketing Report

Your golden ticket to crush your goals with data-driven insights!

Subscribe to our blog

Sign up to receive Rock Content blog posts

Rock Content WriterAccess - Start a Free Trial

Order badass content with WriterAccess. Just as we do.

Find +15,000 skilled freelance writers, editors, content strategists, translators, designers and more for hire.

Want to receive more brilliant content like this for free?

Sign up to receive our content by email and be a member of the Rock Content Community!

Talk to an expert and enhance your company’s marketing results.

Rock Content offers solutions for producing high-quality content, increasing organic traffic, building interactive experiences, and improving conversions that will transform the outcomes of your company or agency. Let’s talk.