Customize Consent Preferences

We use cookies to help you navigate efficiently and perform certain functions. You will find detailed information about all cookies under each consent category below.

The cookies that are categorized as "Necessary" are stored on your browser as they are essential for enabling the basic functionalities of the site. ... 

Always Active

Necessary cookies are required to enable the basic features of this site, such as providing secure log-in or adjusting your consent preferences. These cookies do not store any personally identifiable data.

No cookies to display.

Functional cookies help perform certain functionalities like sharing the content of the website on social media platforms, collecting feedback, and other third-party features.

No cookies to display.

Analytical cookies are used to understand how visitors interact with the website. These cookies help provide information on metrics such as the number of visitors, bounce rate, traffic source, etc.

No cookies to display.

Performance cookies are used to understand and analyze the key performance indexes of the website which helps in delivering a better user experience for the visitors.

No cookies to display.

Advertisement cookies are used to provide visitors with customized advertisements based on the pages you visited previously and to analyze the effectiveness of the ad campaigns.

No cookies to display.

The Making of Fat or Fiction: Infotography

Updated: February 12, 2021

Need content for your business? Find top writers on WriterAccess!

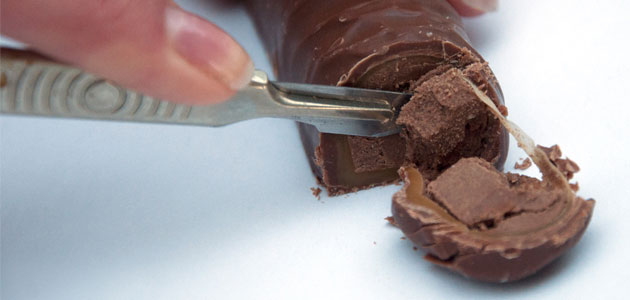
  Fat or Fiction is a series of data visualizations created to bring to life the often overwhelming and complicated nutritional content in food. It showcases the content through Infotography – the relationship between Information and photography. The site is not intended to make you feel guilty about your food habits but to help you make better choices when it comes to guilty pleasures.   The idea for Fat or Fiction was born through our mutual love of treats. We noticed that most calorie counter websites were text-heavy and had a negative attitude towards fat content, which rather than offering alternative suggestions, just made people feel guilty. We wanted to challenge this by talking about calories in a more proactive and accessible way.   We wanted to create something that looks as good as it tastes; after all, looking at cakes is part of the pleasure of eating them. Our ambition was to make something that was visually striking and light-hearted that would help you choose between your favourite treats rather than limiting your options. We created infotography to explore a new way of visualising data that stands out against a vector-dominated art form.   We paired each food group with a chart type based upon their natural similarities in shape. This approach allowed us to use minimum postproduction, and it also makes the data easier to understand. The clean and minimal interface design keeps the infographics as the main focus, making the experience of looking at nutritional information more refreshing. The designs were brought to life using open source frameworks such as Codeigniter and HTML5 Boilerplate. We wanted users to discover the information easily through quirky types of mouse interaction. Revealing the information piece by piece enabled the design to be minimal and simple whilst letting the user decide what to read. To capture the user interaction, we used a vector graphics canvas library called Paperjs. This enabled us to create custom-shaped ‘hotspots’ over the photography. Using an HTML5 canvas overlay worked to our advantage in various ways, probably the most important being custom shapes. Since the Cake and Cheese chart segments are irregular hotspots, we needed to detect when a user was in a specific segment of the chart. We created a tool that allowed us to capture the points of a path around the segments, providing us with a defined area for interaction.   With the positive response we have received so far, it seems as if people are just as interested in infotography as we are. We therefore intend to continue working with this medium and to challenge other topics and ways of visualising data. Christina Winkless, Anna Brooks and David Rosser are three London based creatives that met through working at Digit. Christina Winkless is a designer with a passion for beautiful and intelligent work. Her experience lies in digital and interactive design. Anna Brooks is a designer with a background in photography and a passion for fine art and film. David Rosser, is a Creative Technologist. If he’s not web developing, he’s creating generative mathematical structures and forms in 2D / 3D which he writes about on his blog.

Share
facebook
linkedin
twitter
mail

Human Crafted Content

Find top content freelancers on WriterAccess.

Human Crafted Content

Find top content freelancers on WriterAccess.

Subscribe to our blog

Sign up to receive Rock Content blog posts

Rock Content WriterAccess - Start a Free Trial

Order badass content with WriterAccess. Just as we do.

Find +15,000 skilled freelance writers, editors, content strategists, translators, designers and more for hire.

Want to receive more brilliant content like this for free?

Sign up to receive our content by email and be a member of the Rock Content Community!

Talk to an expert and enhance your company’s marketing results.

Rock Content offers solutions for producing high-quality content, increasing organic traffic, building interactive experiences, and improving conversions that will transform the outcomes of your company or agency. Let’s talk.