Simply put, an infographic is a type of content that presents information using images and minimal texts. It does that in a simple way, facilitating its comprehension by the readers.
There are many types of infographics, which makes it possible to use them in a wide variety of situations for several reasons.
They differ in terms of purpose, how the information is presented, and the types of objects they use, for example. However, most of them combine elements of more than one type to achieve a specific goal.
Besides that, infographics are easy to digest and very shareable. So they are helpful to spread information faster and engage the audience.
For these reasons, it is vital to include this versatile and compelling content in your visual marketing strategies.
Keep reading to find out the main types of infographics and for which purposes they are recommended. We will show you the following types:
- 1. Timeline
- 2. Informational
- 3. Geographical
- 4. How-to
- 5. Data Visualization
- 6. Comparison
- 7. List
- 8. Anatomical
- 9. Interactive
- 10. Visual
- 11. Hierarchical
- 12. Resume
- 13. Flowchart
1. Timeline
This type of infographic shows actions, or events in chronological order.
It can be designed in a vertical, winding, or horizontal format, depending on how much space is available and the information that is going to be displayed.
Timeline infographics can be used to present the history of a company, product, or trend. Therefore, they are effective to increase engagement with your brand and generate leads.
The infographic below (made by ION) shows some facts about chickens from ancient times until today. It is easy to follow each event and its corresponding date through the content.

2. Informational
Informational infographics usually have more text than other types of infographics. They are perfect to explain concepts or topics with the aid of visuals.
For their nature, they are helpful to drive traffic to your website. Moreover, they are useful to build credibility, because it allows you to show your expertise and educate your audience.
The Global Partnership for Education’s infographic presents the benefits of education based on data. Even though it has many charts and statistics, they are only auxiliary to back the information.

3. Geographical
Geographical infographics depict information based on locations or demographic data.
Given that, they are ideal to present the results of a survey or statistics about your products or services’ sales, for example.
You should use them because they help your audience to connect a place to a fact or event, facilitating comprehension and grabbing its attention.
In the last section of Visa’s infographic, there is a map showing how many employees work in its offices located in each region of the world. So it gives a clear idea of how big the enterprise is and where its branches can be found.

4. How-to
This is probably one of the most popular types of infographics. They explain how to achieve a certain outcome and illustrate the steps to do so.
If you can teach your audience to perform an action or use a product, for instance, do not hesitate in creating one.
People love to share content that helps with something. Therefore, the how-to infographic is very likely to reach a big audience, especially for using visual language to make it easier to understand what they should do.
The infographic below presents all the necessary steps to create an infographic. The texts are short and precise. In the end, the readers are invited to put into practice what they learned.

5. Data Visualization
In data visualization infographics, data is the main element of the content. Everything — images, icons, graphs, text — is used to illustrate and present data.
This type of infographic makes it easier to present dense information and understand it. As a result, it is more effective than a long report with plenty of graphs and charts, for example.
Visa’s infographic, which we presented above, aims at informing the numbers regarding the organization’s operations over the years.
It combines features of several types of infographics — timeline, geographical, informational — but the point is the data.

6. Comparison
A comparison infographic lists similarities or differences between two concepts, resources, or anything else that can be compared.
You should use them if you intend to help your audience to choose a service between two options or to highlight the benefits of a particular tool, for instance.
This type of infographic facilitates decision-making processes, making them faster. As a result, it can lead to more conversions.
To help its clients to decide where to work, Hired created an infographic presenting the benefits of living in San Francisco and Los Angeles. They are put side by side, allowing the viewer to easily compare some aspects of those two cities.

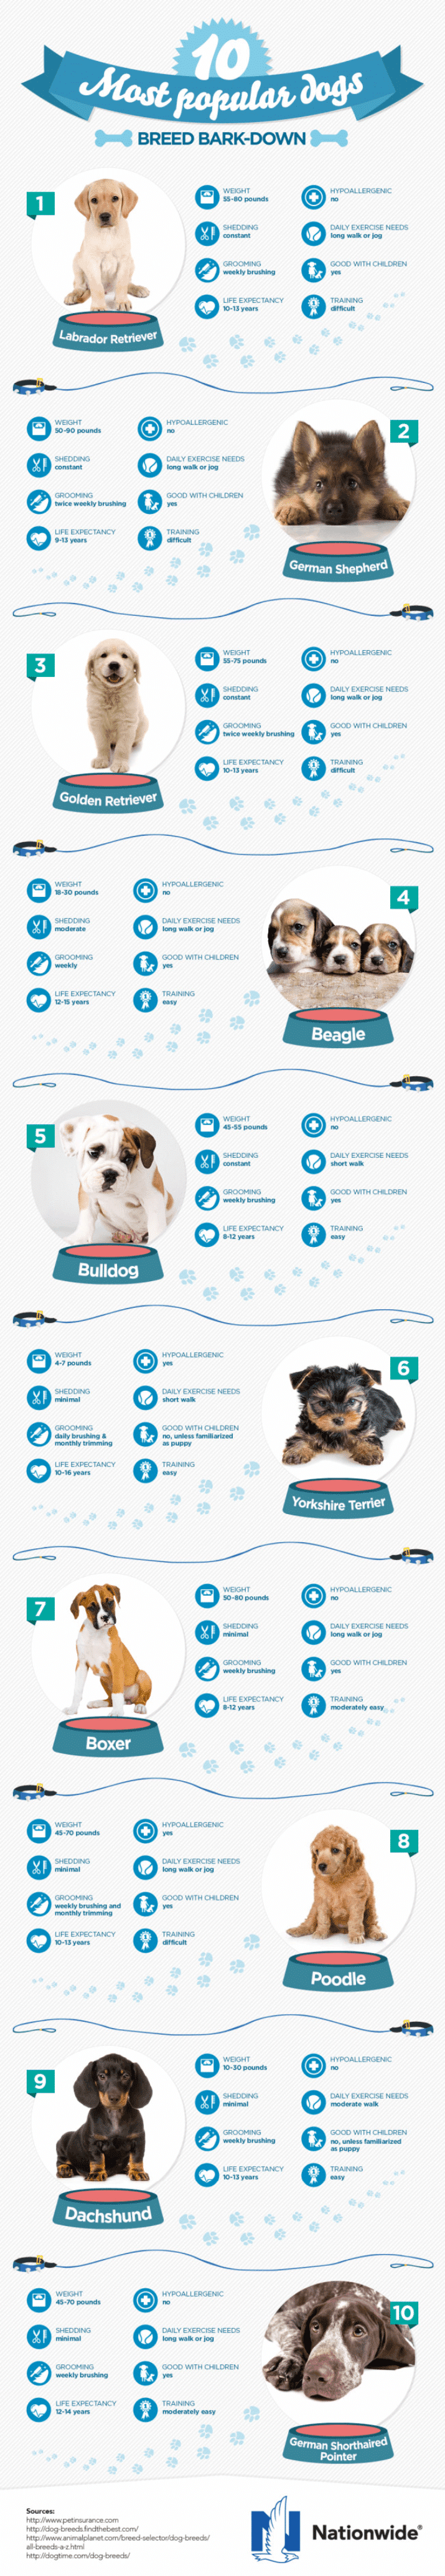
7. List
This type of infographic allows you to organize information in a list and make it more compelling than a basic list. It is possible to use it to list anything that your audience will find useful.
List infographics are effective to grab your audience’s attention and boost engagement because it is one of the most shareable types of infographics.
The Nationwide Insurance invested in the creation of a list infographic with the 10 most popular dog breeds nationwide. It lists each breed and presents its characteristics to help the clients to choose the ideal one.
8. Anatomical
An anatomical infographic breaks down information about a specific topic or tells the audience how a tool or service work.
You can use it to present your company’s services or products, explaining to potential customers how you can help them, for example.
EverString used an infographic to demonstrate how the FIRE approach is the most effective way to find high-quality leads. The content shows what each letter of the word FIRE stands for and the benefits of this approach.

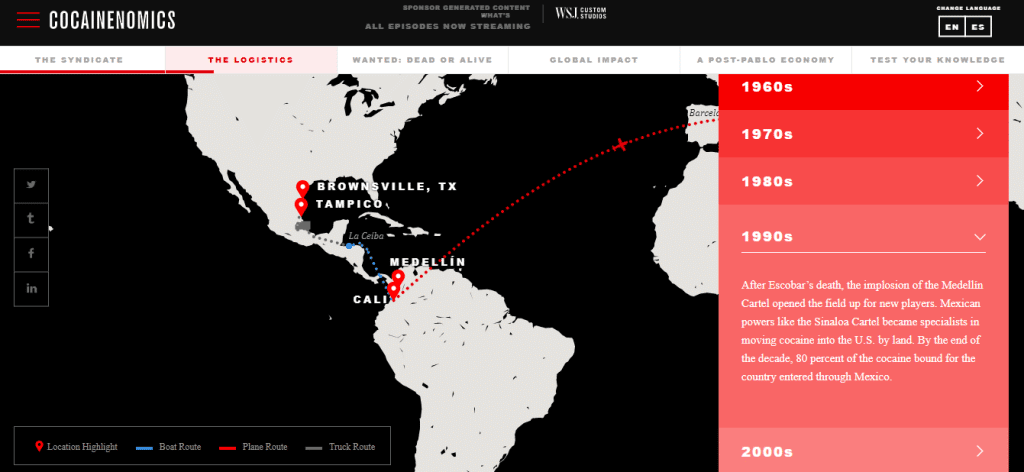
9. Interactive
An interactive infographic allows the viewers to decide how to explore each section of the content by clicking or dragging elements, choosing answers to questions, zooming in, etc.
Interactive infographics are ideal for purposes that aim at engaging the audience and increasing the time spent with the content.
For these reasons, they are perfect to convey information that requires the viewers to take a little more time to consume the content, because they are compelling and stimulate the audience to stay longer so they can explore each point and get its details.
One example is Cocainenomics, a digital experience created by the Wall Street Journal.
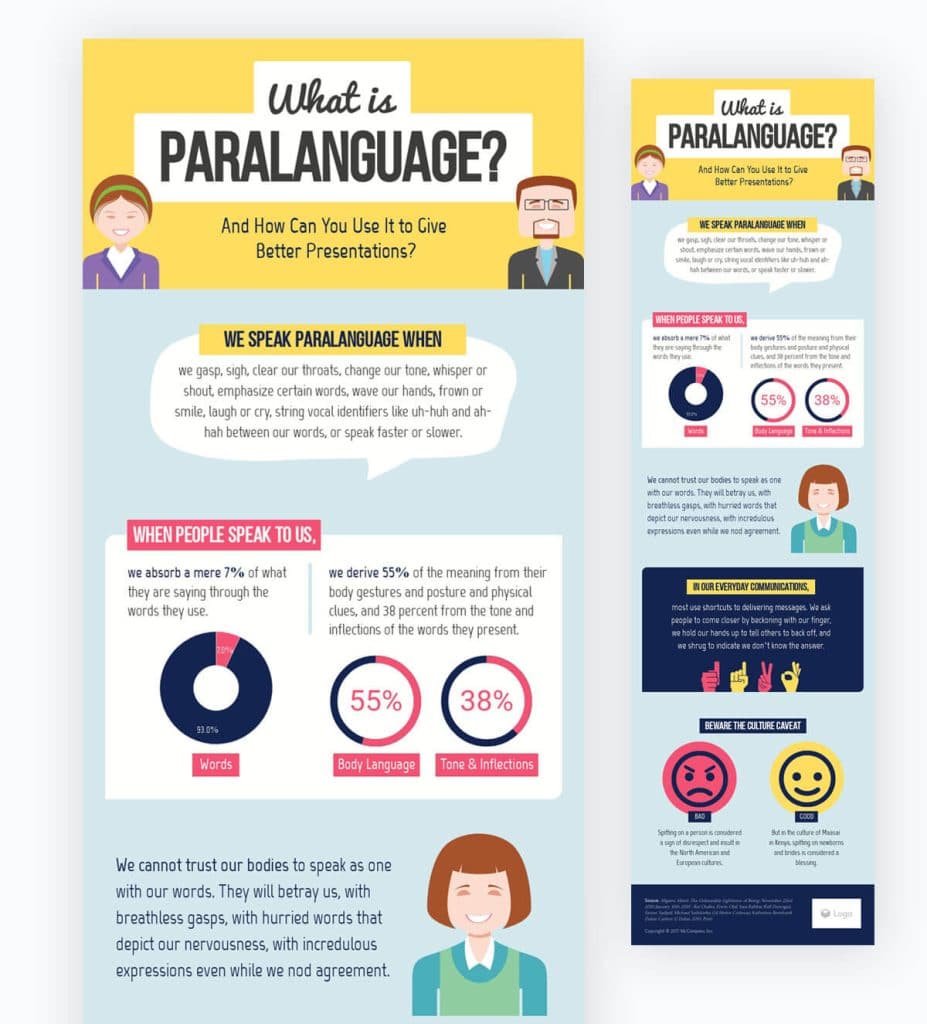
10. Visual
Although fantastic written content is often capable of painting pictures with words, there are many reasons you might want to go with a more visual approach instead.
Visual infographics can take dry reports or otherwise dull information and help it come alive.
Try presenting your information via a visual infographic when you really need to make basic information more exciting or simply less complicated.
These types of infographics are also fantastic for times you really want to encourage your audience to share your content.
This infographic about paralanguages is a terrific example of what makes visual infographics work. Bright colors, a cartoony design, and useful graphs help present the facts in a fun, approachable way.
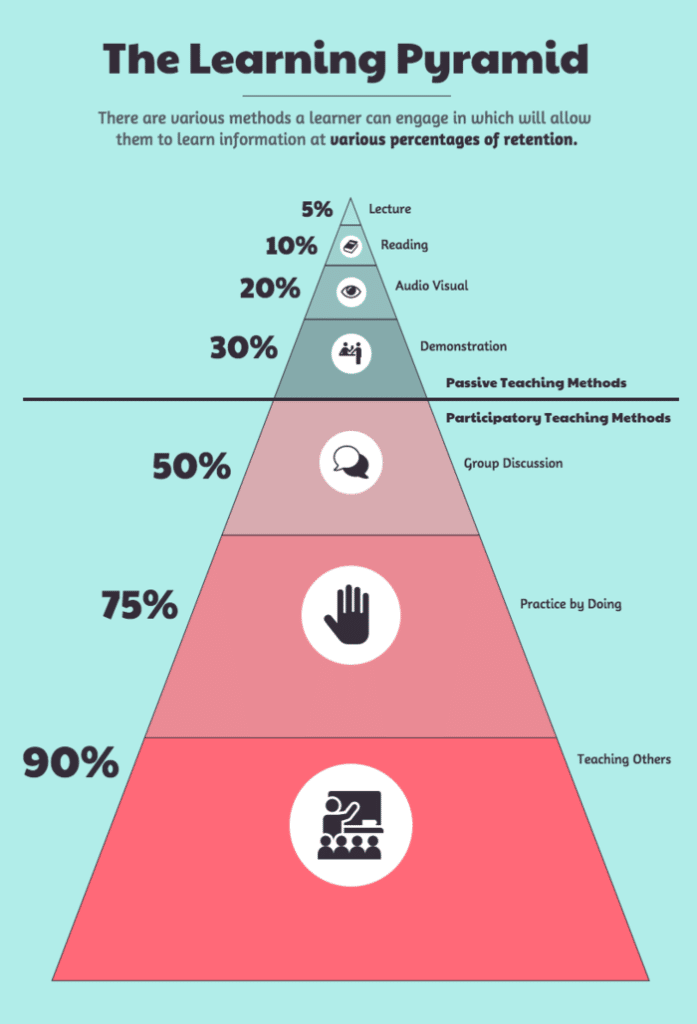
11. Hierarchical
Hierarchical infographics are types of infographics that help visually organize tier-style information from greatest to least (or vice versa).
As with visual infographics, hierarchical infographics take information that may not seem interesting on its own and make it more appealing.
They also make it easier for an audience to remember the information. Generally speaking, it’s easier for people to recall something visually approachable like a graphic than a numbered list or a prose-style explanation of the same information.
Pyramids are popular ways to visualize information for hierarchical infographics, as seen in this example about learning methods.
The viewer can see at a glance that participatory learning methods are more effective than passive learning methods, as well as which options are most efficient.
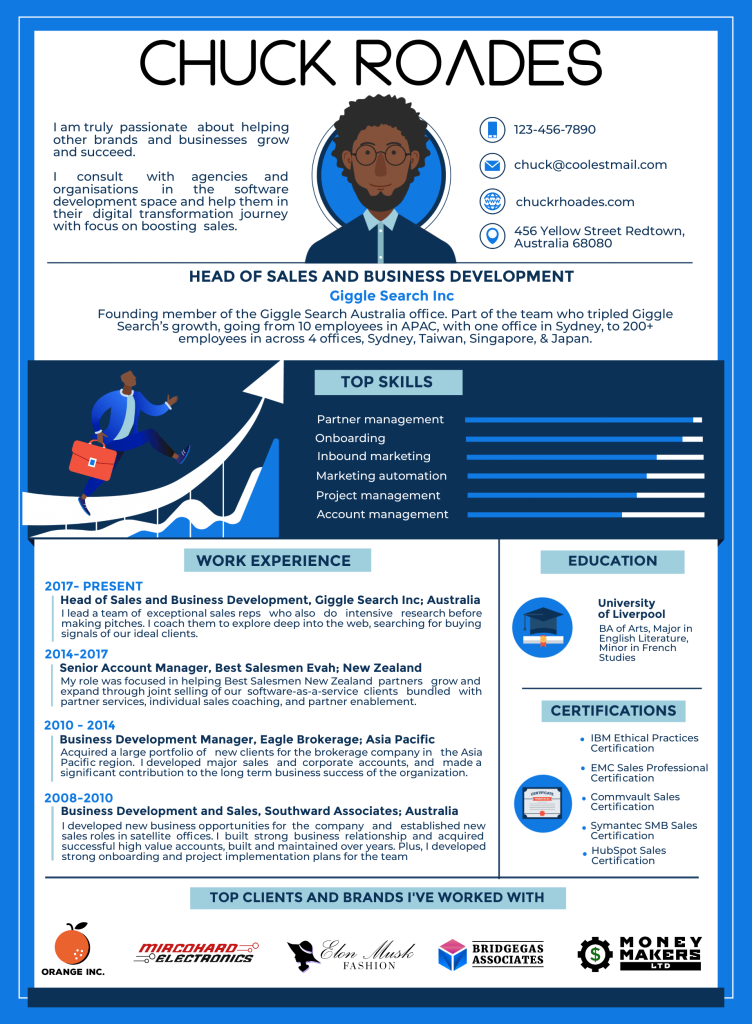
12. Resume
Using infographics to present key information in a more visual format isn’t just a great method to repackage data, statistics, or facts.
Infographic resumes can help you stand out in competitive job markets and industries.
Switching to an infographic resume is a wonderful way to stop a hiring manager in their tracks and get them to see a candidate as someone well worth a second look.
They also show (instead of telling) that the candidate is creative, innovative, and determined to bring something unique to the table.
Infographic resumes can be especially effective when applying for positions in creative fields or with brands that value outside-the-box thinking.
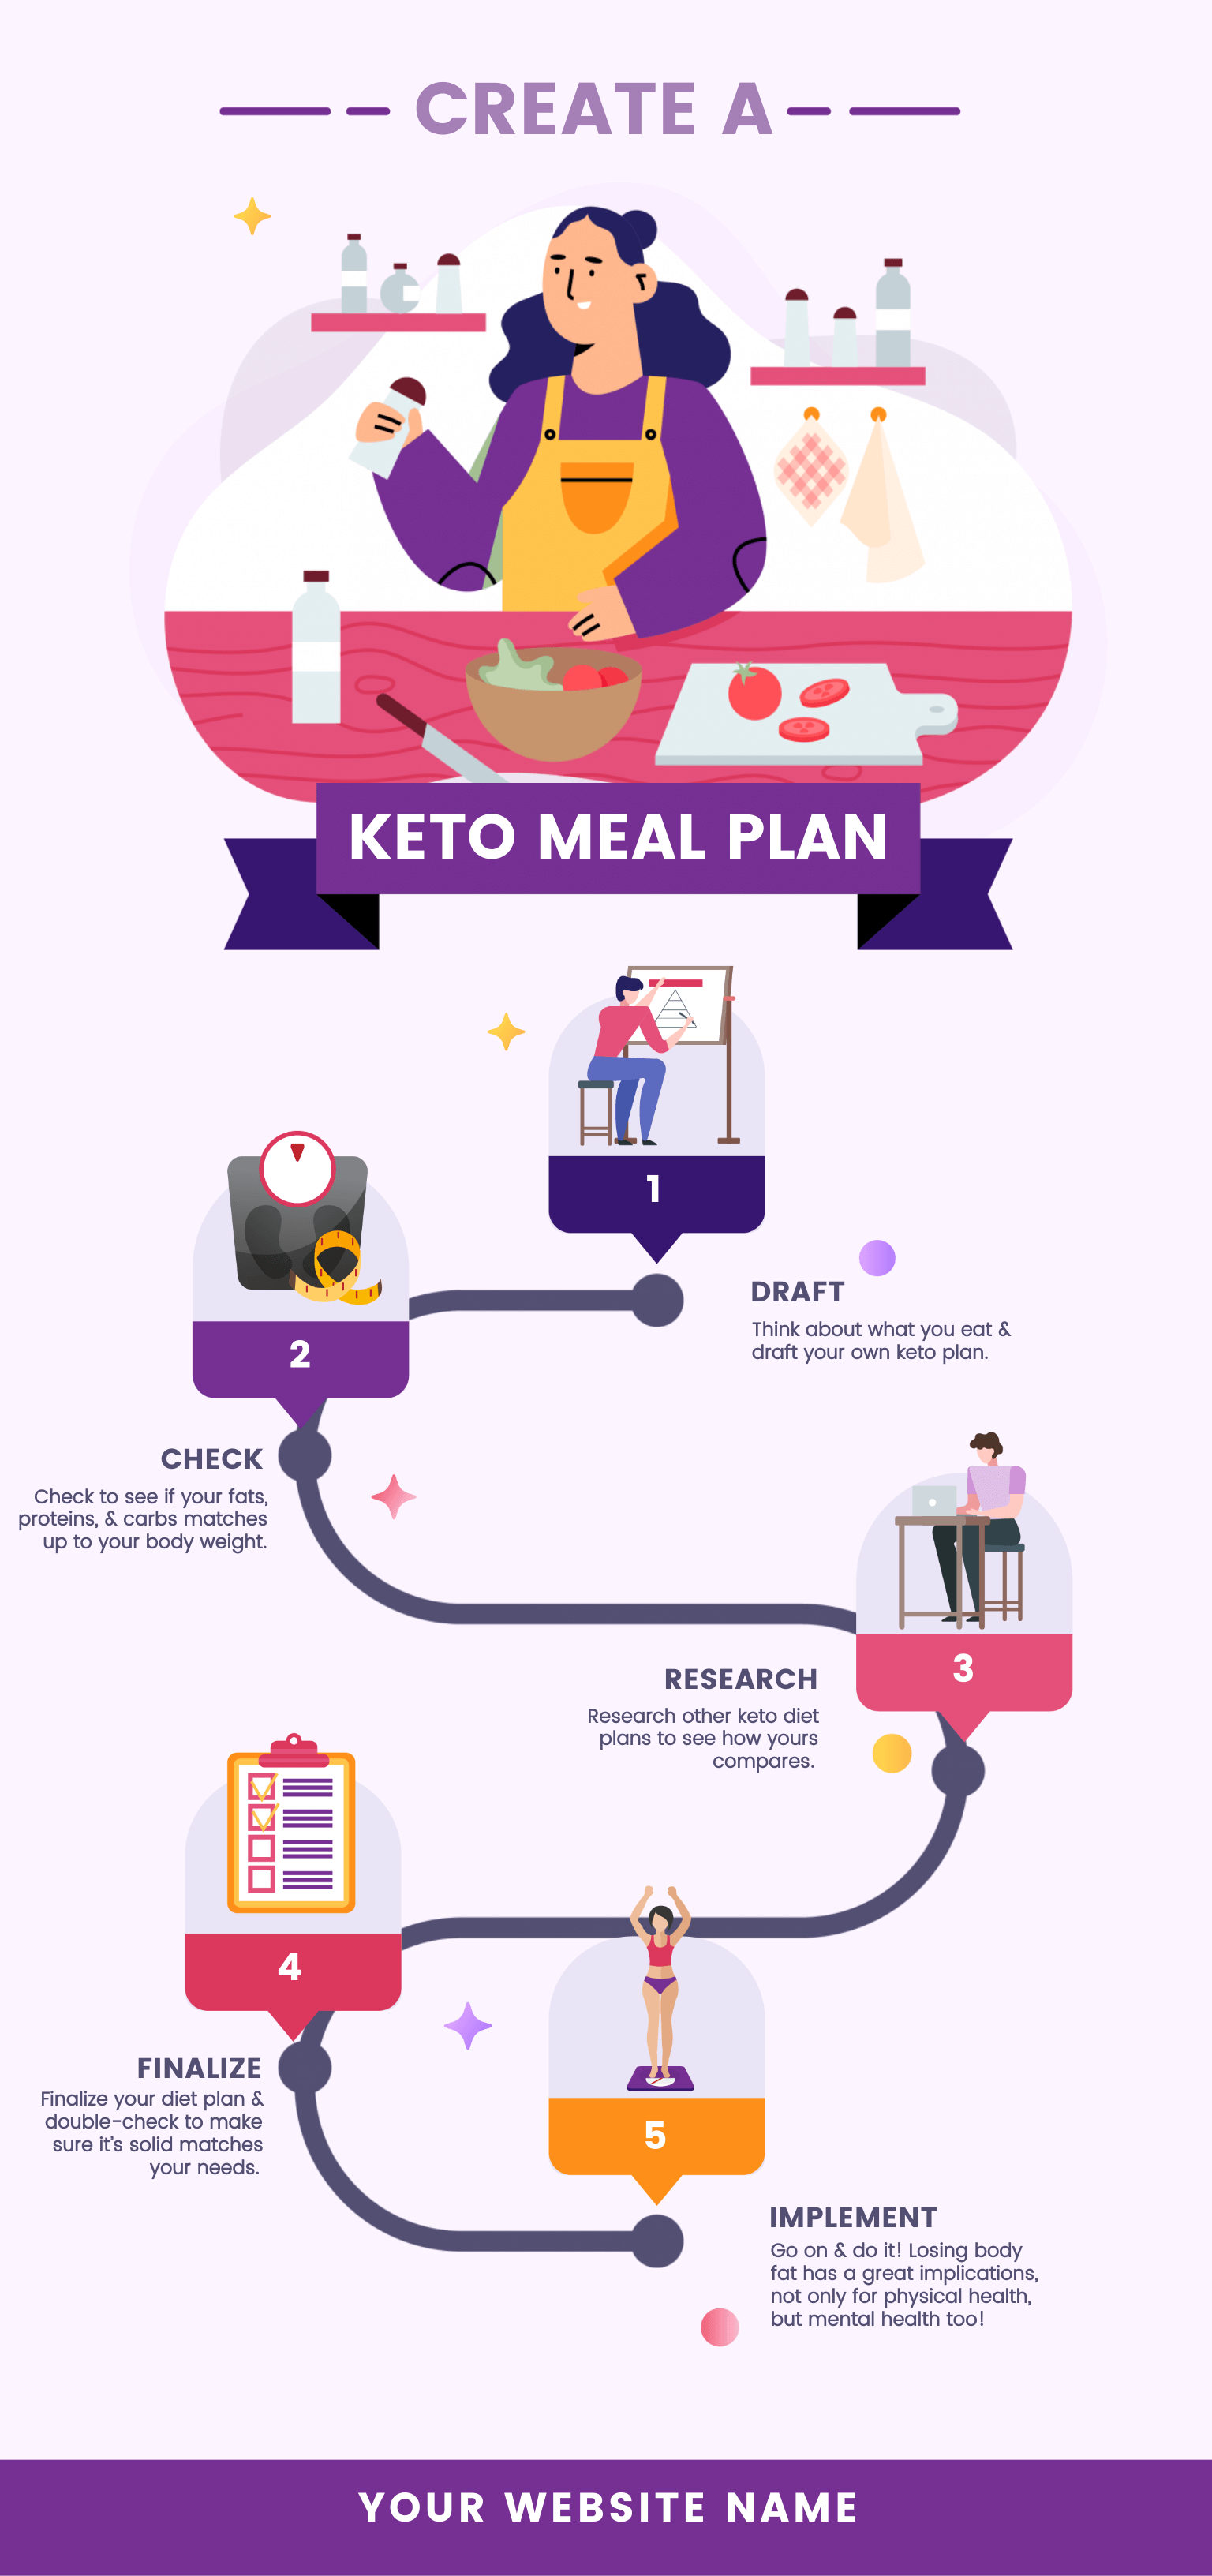
13. Flowchart
Flowchart infographics are types of infographics that break down potentially complicated workflows, processes, or procedures and make them approachable at a glance.
They’re also fantastic for answering specific questions your audience might have in a way that feels personal, fun, and accessible.
Try using a flowchart infographic when you want to simplify a potentially confusing topic or solution for your readers.
This is also an effective way to show your target audience at a glance how different approaches can lead them to the same end result.
This infographic on putting together a solid keto meal plan is an excellent example of how making a multi-step answer visual also makes it easier to digest.
To create these types of infographics you can use templates available online.
However, be careful when picking one. The best way to build an effective content strategy using them is to count on experienced professionals. They will be able to help you in every step and identify what will work better for your audience.
Excited to transform your content with interactive infographics? Dive into the world of ION! Elevate your infographics with engaging elements, quizzes, and more. Unleash the potential – try ION now and take your content strategy to new heights!