 A wedding is one of the most exciting and memorable experiences of a person’s life. So much effort, work and time goes into planning this special event. Family, friends and loved ones share the couple’s joy, standing by their side as they exchange vows to spend the rest of their lives together. A few weeks before my own wedding, I spoke with a good friend, Raj Kamal, who also happens to be one of the world’s best information designers. We discussed the upcoming wedding and I complained about how complex it is to plan such a big event (we had more than 300 guests!): from picking the right location and choosing the best food, flowers and DJ, to arranging the seating chart, and so on. What did Raj say? “You forgot the infographic!” “What infographic?” I asked. “Come on man,” Raj said. “You’re a founding member of Visually, and there is so much data related to you and your wife-to-be… are you not going to visualize it?” He was, of course, absolutely right. Raj and I started to throw around ideas for what would be one of my own unique contributions to my wedding day. We wanted to figure out how to tell the story of two people who fell in love and how their relationship came to be, but in a minimalistic manner, where visuals took the place of words. This was no easy feat, and even working at Visually and having seen a graphic or two – including those made for weddings – nothing really stood out, style-wise, for what I had in mind. One rule we set in stone from the get go was that this project must be done right. We must try to create the best approach to tell a couple’s story in a minimal and efficient way, with a clear story narrative. The goals of the project were pretty simple:
- Allow the guests to get to know the bride and groom better, since guests were coming from around the world and how well they knew us varied widely.
- Have a souvenir for life: something we can hang on our wall, hopefully for our kids to see one day — and learn our story in a simple, visual way, maybe even before learning to read.
Once we found the story we wanted to tell, we were finally ready to run with it and create the wedding infographic. 


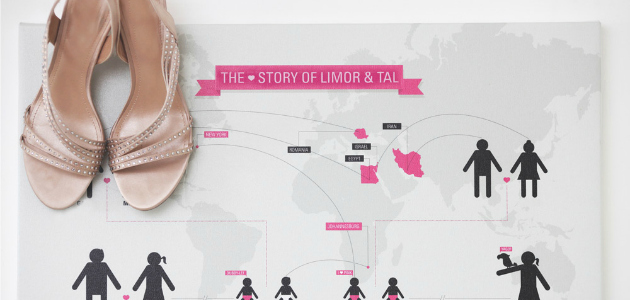
 You can click on the graphic below to see it in detail. We have changed the data a bit, so it is more suitable for public viewing.

Want to create an infographic for your wedding or as a gift to your favorite couple? One of the reasons we created the Visually Marketplace was to allow brands, companies and individuals to tell their stories and make an impact with them. Telling the story of a newlywed couple wasn’t any different, and heading to the Marketplace for the project was a natural step in the process for us. So it can be for you, too: contact us and let us know what we can do for you! Tal Siach is the CMO and co-founder of Visual.ly. To see more of his favorite infographics, visualizations and other cool stuff from around the web, follow him on Twitter.