Summer is heating up in the northern hemisphere, and July is national ice cream month in the US. Designers and infographic creators everywhere love ice cream, and it’s evident through all the infographics they’ve created. There is a full range of topics to cover on ice cream, from consumption, to ingredients, to colors. As a tribute to the mouthwateringly good chilled cream, here is a list of twelve ice cream infographics.
- Ice cream is a delicious treat for hot weather that almost everyone loves, but there may be a lot of stuff you don’t know about ice cream.
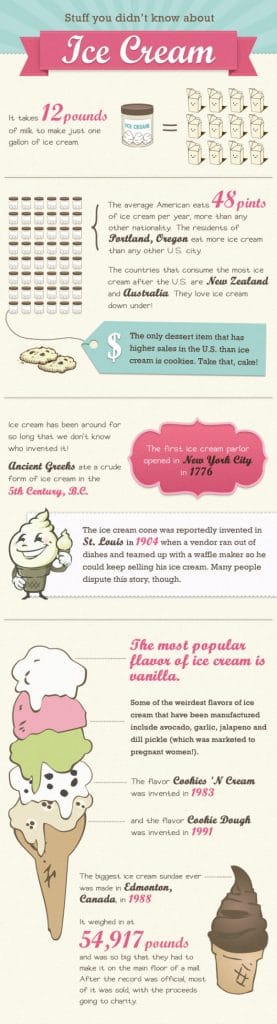
Stuff You Didn’t Know About Ice Cream infographic
2. Not everyone consumes the same amount of ice cream, and some countries consume more than others. Check out which countries consume the most in Global Annual Ice Cream Consumption.
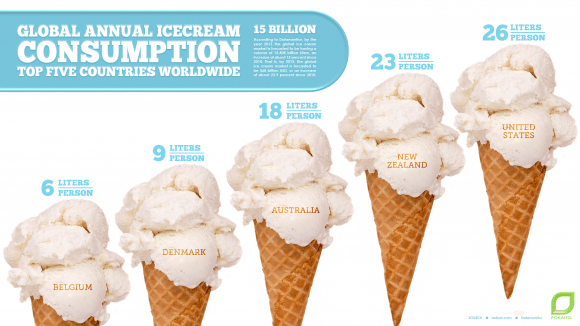
Global Annual Ice Cream Consumption: Top Five Countries Worldwide infographic
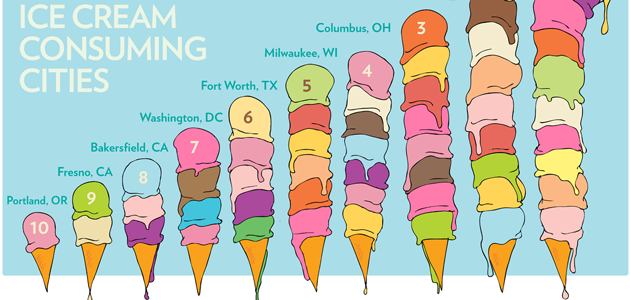
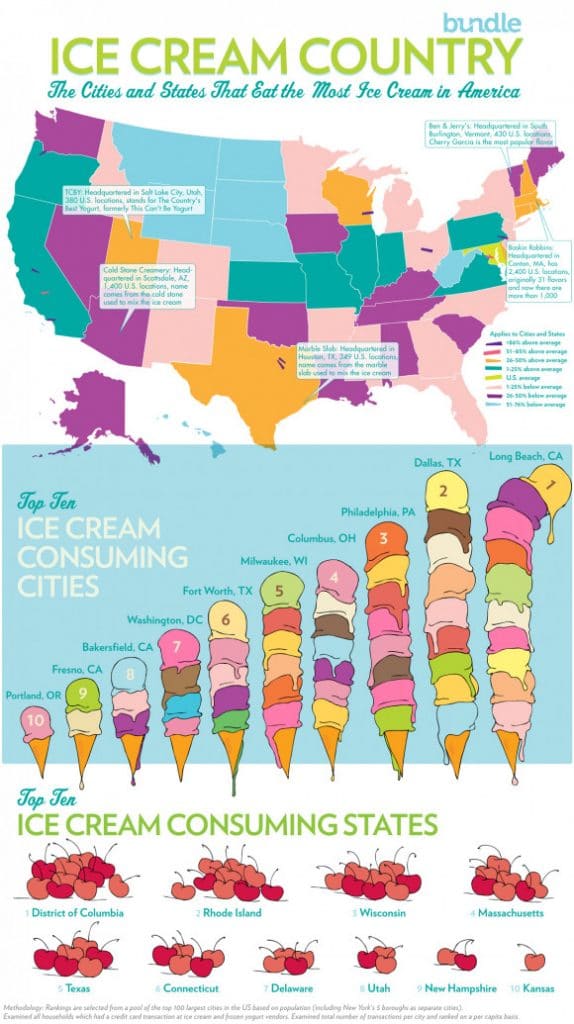
3. Speaking of ice cream consumption, it varies among different regions in the United STates, as well. Ice Cream Country highlights the top ice cream consuming cities and states.
4. Ice cream isn’t the only frozen treat, of course. Gelato is a great frozen snack.
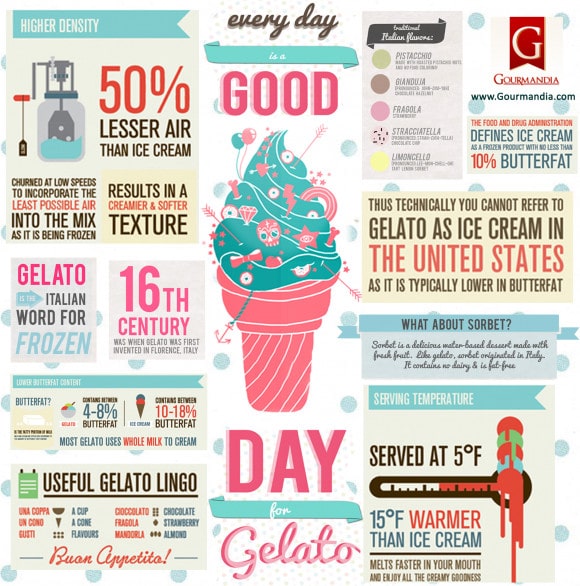
Good Day for Gelato infographic
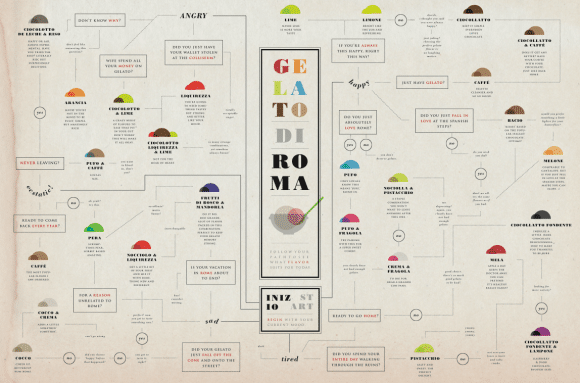
5. And if you can’t pick what flavor of gelato you want, try this flow chart of the Gelato of Rome
6. You could also make similar decisions for ice cream based on what you are doing next.
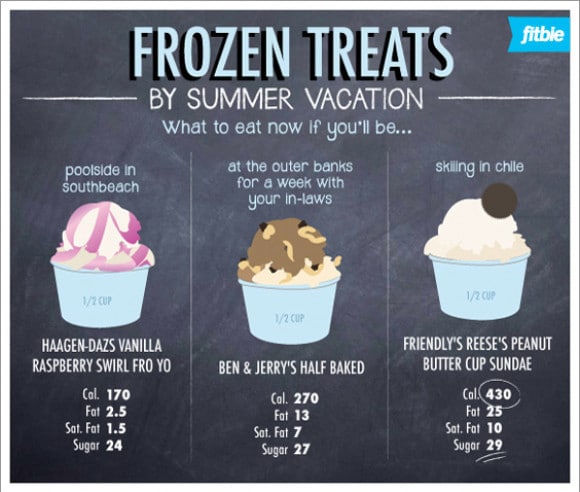
Frozen Treats infographic by LindsaySnowOsborn.
7. Ice cream comes in all colors, and some designers have used that as inspiration. Retro Ice Cream shows some color palette options based on ice cream colors.
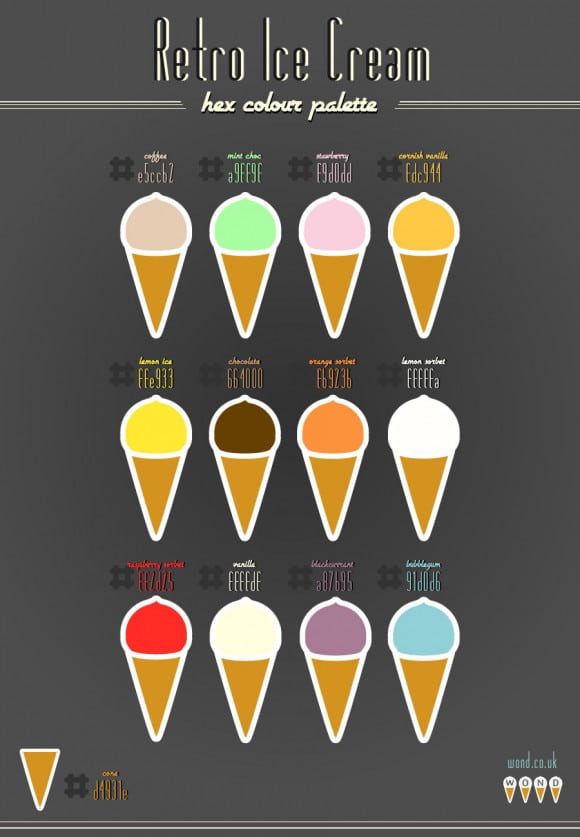
Retro Ice Cream Colour Palette infographic by wond.
8. It also comes in some pretty strange flavors. 10 Weird Ice Cream Flavors shows ten of the strangest.
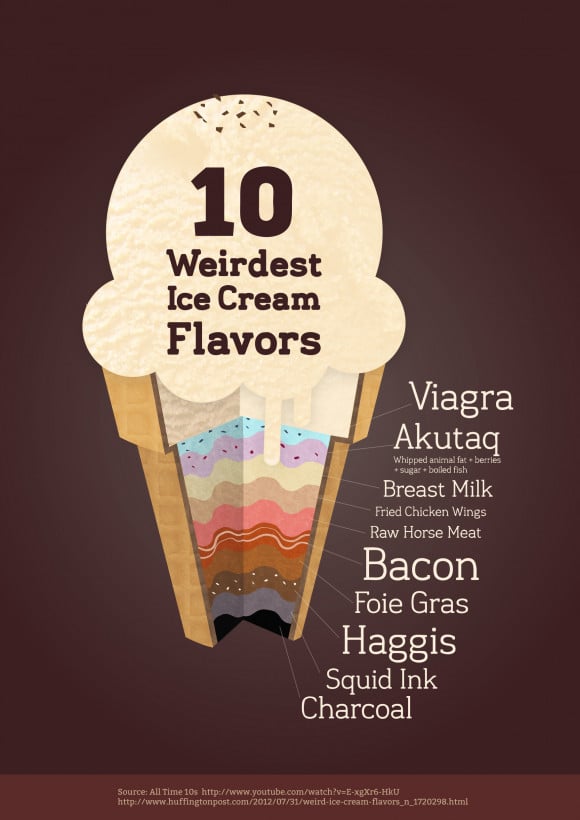
10 Weirdest Ice Cream Flavors infographic
9. Another strange flavor is a Bacon Sundae. The (perhaps genius) concoction is 510 calories, and takes a five mile run to burn off.

Burn Off that Bacon Sundae infographic by LindsaySnowOsborn.
10. With all those strange flavors, you may be wondering, What’s in that Ice Cream?
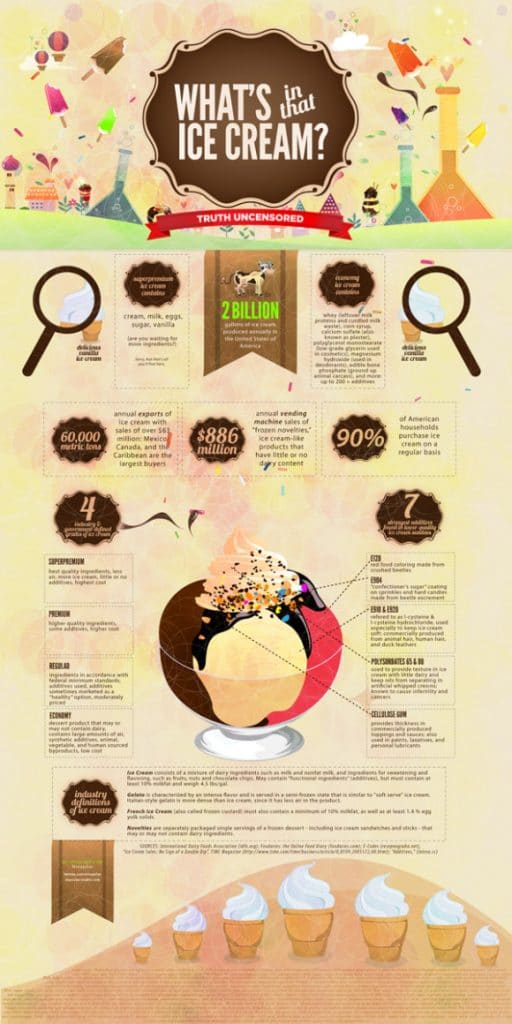
What’s in that Ice Cream? infographic
11. The ingredients, of course, directly impact the Health of Your Ice Cream.
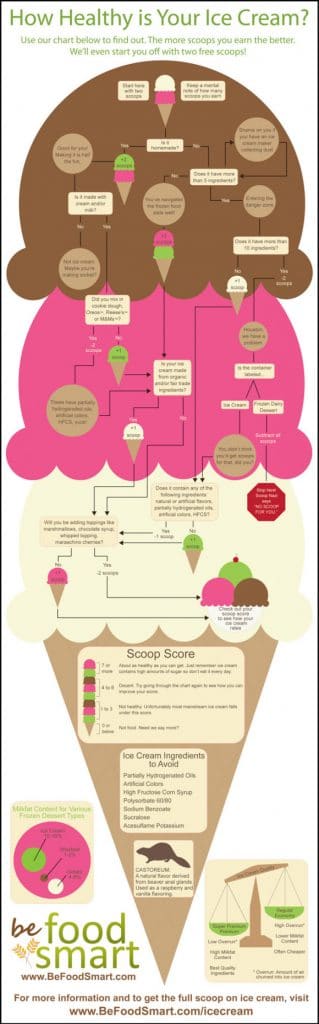
How Healthy is Your Ice Cream infographic
12. If you want total control over the ingredients and how healthy your ice cream is, you could always Make Your Own Ice Cream!
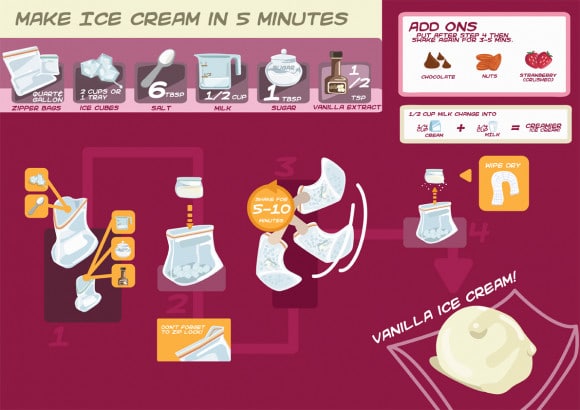
How to Make Ice Cream In 5 Minutes infographic
Here’s to a nice big bowl of melt-in-your-mouth, tongue chilling, brain freezing ice cream! Drew Skau is Visualization Architect at Visual.ly and a PhD Computer Science Visualization student at UNCC with an undergraduate degree in Architecture. You can follow him on twitter @SeeingStructure