There are plenty of national days and even months these days, during which we celebrate all kinds of things — not very many of them encouraging healthy living or exercise. (Case in point: June is National Candy Month, and June 16 is Fudge Day. Enjoy.) Then there’s National Running Day, held on the first Wednesday in June and celebrated by simply lacing up and going for a run. In 2013, National Running Day is on June 5, and to encourage you to join in the festivities, we thought we’d offer up some visual motivation. Check out these 12 infographics about running, get hyped up, and run! 1. Running outside may be free, but unless you want to get injured, you’ll need to pony up for the right pair of running shoes. And no, that doesn’t mean your favorite color or the coolest brand of the moment. Do that, and you may find yourself the proud owner of several black toes and bloody blisters, or worse — a stress fracture. Be smart and head to a specialty running store to get your feet measured and your stride examined, then buy the shoes recommended by the store clerk. In the meantime, REI’s How to Choose Running Shoes infographic gives you a run-down of the basics.
2. If you didn’t heed the advice above and ran a 10K in your Converse sneakers, your body may be complaining. Or you did get the right pair of shoes, but got injured anyway. It happens. The infographic below lists the most common running injuries, along with their typical causes and symptoms.
3. Most runners fear not bloody blisters or chafed underarms, but the horrible boredom caused by running on a treadmill. The treadmill workouts infographic below offers some encouragement:
4. One item on the bucket list of many runners is running a marathon. And intimidating as 26.2 miles may seem, the fact is that with proper training and preparation, anyone can do it. No, seriously. Here’s a visual guide to marathon running to get you started.
5. Every marathoner’s dream? Boston. The Boston Marathon takes place the third Monday of April (observed as Patriots’ Day in Massachusetts) and to qualify for it you’ve got to be fast. The infographic below looks at finish times for men and women and uncovers some interesting findings.
6. Another iconic marathon is that in New York City. It is visualized in this infographic.
7. So how much energy do you spend running a marathon? What about other sports? Energy in Sports has the answers.
8. On the subject of energy, Calorie Intake and Outtake visualizes how much we need to run (compared with other activities, like walking or yoga) to spend the calories consumed by certain foods.
9. Remember all that talk about running shoes? Some people shun shoes altogether — and the trend has been on the up. It’s the Barefoot Running Revolution!
10. Also on the subject of running barefoot, Free Your Feet looks at why running shoes (allegedly) do more harm than good.
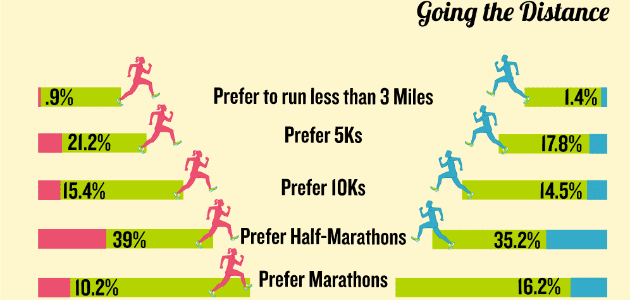
11. The curiously-named Sports Bras vs Speedos infographic (we’ll take the former, thanks) visualizes survey results where you will find runners’ opinions on pretty much everything related to the sport, from preferred distance and time of day to run, to gear and motivation techniques.
12. If you’ve been running for a while, sooner or later you’ll find yourself plateauing — not seeing the progress you’d been making when you first got started (i.e. getting faster, fitter, slimmer — all that goodness). The solution? Introduce some interval training: workouts where you alternate high-exertion exercise (say, sprinting) with periods of rest. You can do that in cross-training, too: This Guide to Interval Training walks you through the main types of interval training and suggests some workouts that you can implement in runs, bike rides or gym workouts.
Aleksandra Todorova is the Editorial Director at Visual.ly. When she isn’t editing or creating infographics with the team, she runs.