Download this post by entering your email below
In interactive visualisation, there is the word reactive. Well, maybe not literally, but close enough. The fact is that reactivity, or the propension of a visualisation to respond to user actions, can really help engage the user in a visualisation, and help them understand its results. Both of which are usually good things. How can this reactivity be achieved? Through animations. So I’ll go ahead and state that animation, if done right, can make any interactive data visualization better. How is that?
- When coupled with interaction, it’s a very useful way to give feedback to the user. What has changed since their last command? If what’s on screen animates from one state to another, it’s obvious, it stands out and it makes sense. Or, when showing any form of real-time data, animation is pretty much required.
- Animation can bring focus on the important things as a chart loads. Our vision is very sensitive to movement, so using these introduction transitions sensibly helps a lot to ease the effort required to get the right information off a chart.
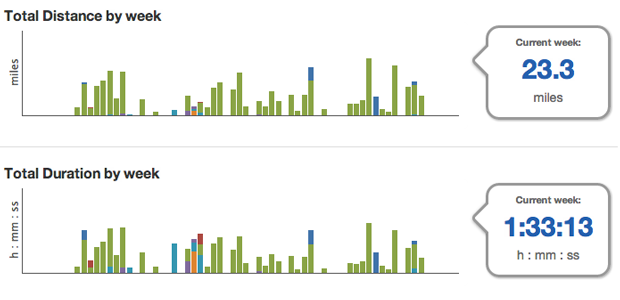
Compare these two charts:
Which is better at getting the viewer’s attention on the last bar?
[side note on examples: they all use the same model. Click on the button to start an animation. If there is nothing on the chart, clicking the button will make something appear.]
- Animation works well with metaphors like growing, expanding, moving, dwindling, etc., so it can really enhance the expressiveness of a visualization that tries to convey any of these ideas.
That said, animation can definitely ruin your visualization, too. Here are three general problems.
- Animation is very prominent. That can be good to call attention to a specific, unambiguous part of your chart. But what happens when there is too much animation? Without other cues, it gets difficult for a viewer to determine where to focus their attention.
- Animation across many states (like a video of animated data) make them difficult to compare to one another, as opposed to showing still images of various states side by side.
- If the animation is not continuous, if the chart is somehow wiped out during it, this causes change blindness, which pretty much negates any benefit you may have hoped to reap from animation.Look at this example:
When animated, the line goes through a blank state, which makes it close to impossible to track changes between the original and final state. The only way to detect change is to focus on one given point and memorize its original position, but this is very ineffective.
Now how to do it?
So we’ve seen how animation is helpful in data visualization. Now, let’s do it! For this purpose, let’s use d3. d3 has many, many possibilities when it comes to data animation, and they are relatively painless to implement.
The principle
If you know how to draw in d3, you almost know how to animate. (And if you don’t know yet, Alignedleft has a splendid collection of tutorials to get you started, and the d3 site lists more, including some by yours truly.) Animations are called “transitions” in d3 for a reason. A technical definition of animation can be that over a certain lapse of time, one or more characteristics of an object would transition from one value to another. By characteristics, we mean just about anything that can be expressed numerically.
A few examples of transitions
Not surprisingly, when you update the position of an item smoothly over time, it moves. In svg, position is determined for most shapes, such as our blue rectangle here, by the x and y attributes, which correspond to the top-left corner of the shape. For circles, you use cx and cy, or the coordinates of the center. For paths, such as our red triangle, you actually specify the position of all of the points in the “d” attribute.
Likewise, when you change size, your object grows (or shrinks). You can use width and height for shapes like rectangles, or r for circles.
Color is really a numerical attribute, too, and it is indeed possible (and very useful) to transition from one color to another. In svg, color is a style attribute that is defined by fill or stroke.
Not unlike color, it’s very useful to be able to vary opacity. When opacity is set to 0, the corresponding object is completely transparent. So transitioning on opacity is very useful to make objects fade in or out.
How this is done
Now that we’ve seen what transitions can do, let’s see how to code this in d3. Let’s go back to our first example. In fact, let’s make it even simpler.
To create a square like this in d3, we would write something like:
var mySquare=svg.append("rect") .attr("x",60) .attr("y",60) .attr("width",60) .attr("height",60);
4 attributes. Simple enough. So if we want to make it move to the right, we are going to update the x attribute. That’s how we do it:
mySquare .transition() .attr("x",320);
It’s that simple: use the transition method, then specify all you want to see changed just as if you were creating a new item. And using that one principle, we can easily reproduce any of the above examples.
mySquare .transition() .attr("width",120); // will make it bigger mySquare .style("fill","white") // if the fill is originally left blank and comes // from a style sheet, it will start as black .transition() .style("fill","blue"); mySquare .transition() .style("opacity",0);
Now, in our simple examples, this is not exactly what happens. The transitions occur after an event, namely, when the user clicks on the button. And indeed, transitions are most useful when linked to events and interaction. But this doesn’t add a whole new layer of complexity. We can just write:
button.on("click", function() { mySquare.transition().attr("x",320); })
And now, our animation only starts when the button is clicked. Obviously, since the transition is within a function, we could even determine where the square should go programmatically, but let’s keep it simple for the examples.
Animation 102
So far, we’ve seen how we can do simple animations in d3 and even throw in a little interaction. We’ve seen that it’s really as simple as creating elements in the same place. The good news: transitions in d3 are extremely versatile and can be customized with a lot of finesse without getting overly complex to write. It’s more a matter of knowing what to do.
After using the transition() method, it’s possible to specify a value for duration and delay. Duration is the number of milliseconds the transition will last, while delay is the number of milliseconds the system will wait before launching it. The syntax is:
mySquare.transition() .attr("x",320) .duration(1000) // this is 1s .delay(100) // this is 0.1s
The default is a 250ms duration, and no delay. I find 250ms to be a bit harsh. In most cases, transitions should be noticeable, so I oftentimes find myself increasing the duration to 500 or 1000. But unless there is a very good reason for that, durations should not be too long. If you use them to support your data, you don’t want the transition to take center stage by having them take several seconds.
Consider the following two examples (which you’ll have to start with the button):
Isn’t the second one simply atrocious? You may find it hard to believe that it only wasted 25 seconds of your time.
Easing is the technical name of the actual function that turns time into attribute changes. From the previous examples, you may have noticed that the values change slowly first, and then faster, then slowly at the end. Well, it turns out that you can use different functions to get different results. In my practice, I’ve only seen the use for the three displayed here, although there are many others. And yes, you can write your own, although we are not going to cover this here. The syntax is similar to the above:
mysquare.transition() .attr("x",320) .ease("elastic")
(and by the way, the order in which you change attributes or specify animation parameters has no effect, so feel free to use .ease first then .attr).
For path objects, through transitions you can update the position of each point. This allows you to effectively turn one shape into another. This can be especially interesting for line charts (or any chart which is a path).
Like this, if the values that you are plotting change, you can spot these changes very efficiently. If, instead, you just erase your chart or redraw your data it would be very difficult to spot where the data has changed. For both of these examples, the “d” attribute of the path is updated (so they are not intrinsically different from the simplest example).
Sometimes — often, actually — you want to fire a transition right after another transition. But in case you were wondering, the following doesn’t work:
mysquare.transition() .attr("x",320); mysquare.transition() .attr("y",200);
You may think that this will move the square right, then down. But no: it will start to move the square right, then fire the second transition which will move it down. Since they have the same duration and no delay, what will happen is that only the second will have a visible effect. If the second transition had a delay, smaller than the first transition’s duration, the first one will be in effect for a while until the delay expires. Then, the second transition will take over. However, chances are you don’t want to do that, because how much of the first transition will have been accomplished depends on the user’s machine, browser etc., and is therefore unpredictable. So how about giving the second transition a delay that corresponds exactly to the duration of the first one? This will usually work, but the delays and durations are not extremely accurate. Firing the transition properly takes a certain time (which is roughly 15ms on my machine and may vary), so it is difficult to chain two transitions very precisely this way. In more complex programs than our simplistic examples, sometimes, several events try to trigger transitions on the same object. When this happens, the first transaction is fired, and runs its course unless another transition starts. That second transition would interrupt, then replace the first one. What this means is that the attributes that were in the process of being changed by the first transition will remain as they were when the second transition starts, somewhere between their start and target value. If you want to make sure that all your transitions update their attribute up to the value they are supposed to reach, you may want to re-specify the attributes of the first transition in subsequent ones, like so:
mysquare.transition() .attr("x",320); mysquare.transition() .delay(250) .attr("y",200) .attr("x",320); // even if the first transition doesn't complete, // this one will and will update x to 320.
There is a more certain way to chain two transitions. With the following syntax, another event will start exactly at the end of a transition. That other event can be another transition (which is the case in the above example).
mysquare .transition() ... .each("end", function() { ... });
Here, what’s in the callback function on the last line, introduced by .each(“end”, will be fired exactly as the transition ends. What can be done then? Here are 3 common scenarios.
(if you’re wondering what the difference is between this and the previous example, there is none – it’s just to save you some scrolling). One possibility is to launch another transition on the same item. Here, the square moves right, then down. Here’s how it’s done:
mysquare .transition() .attr("x",320) .each("end",function() { // as seen above d3.select(this). // this is the object transition() // a new transition! .attr("y",180); // we could have had another // .each("end" construct here. });
Another possibility is to delete the object after the transition has run its course. This is super useful, especially when you are creating a lot of temporary objects. An interesting combo is when you decrease opacity all the way to 0, making it invisible, then using remove() if you don’t need it anymore.
mysquare .transition() .attr("x",320) .each("end",function() { d3.select(this). // so far, as above remove(); // we delete the object instead });
Finally, we can create a new object. That can be a nice way to add a special effect. Here’s an example:
Here, at the end of the transition, a circle is created, a transition is started on that circle, which decreases opacity to 0, then the circle is removed.
And here is one last example with several effects combined.
Going further
Believe it or not, we barely scratched the surface of what can be achieved with animations in d3. There are two other uses of transition that we haven’t seen because they are slightly more complex, so I’ll just mention them here. Up until now, we have always seen transitions based on the properties of one specific object. We make the x property of that one square vary from what it was to 200. Sometimes, though, you want many parts of your visualization to be updated according to the changes in one variable. That is possible, too, by using the .tween and .interpolate methods. All of this is explained in the d3 documentation. Another possibility is the use of the d3 timer method, which allows to call a function repeatedly, which can also be used to create animation. The point I was hoping to make was that it’s possible to do a lot with relatively simple code and technique if you know what you are trying to do. Chaining transitions, particularly when adding and removing objects when appropriate, goes a long way in creating powerful effects.
For the ambitious, this is a great intro to creating your own animations and transitions in d3.js. However, if you feel like you’re in over your head, drop by the Visually Marketplace and hire one of our talented developers!
Jerome Cukier is a freelance data visualization expert from France. He has his own blog with several other D3 tutorials.
![[ROCK NA] [EBOOK SEO] Complete Guide](https://rockcontent.com/wp-content/uploads/2024/06/banner_Search-Engine-Optimization.png)