Download this post by entering your email below
Even if you think you don’t know what a choropleth map is, chances are you’ve seen one. And come November 2012, you’ll see plenty: one iconic example of a choropleth map is a map of the United States, laid out in red and blue, showing the results of a presidential election. Choropleth maps can be simple, like in the example above, where the color of the state indicates whether the state goes in one direction (Democrat) or the other (Republican). The states can also be colored on a scale to indicate data, with a color like blue representing a low number and red representing a high number, leaving a number in between to be purple. These simple visualizations make large amounts of data easy to understand at a glance, allowing insights that would take much longer if you’re looking at a table of numbers. But the process of making these maps is not easily apparent. There have been tutorials for Python and Excel, but none that we’ve seen yet for D3 — and D3 is one of the easiest ways to make choropleth maps for the web. Once you have your data encoded on a webpage using D3, you can access it and display it in new ways. In this example we are going to be making a map of the results of the 2008 presidential election. Let’s start with our base map. We’ll get the .svg file of the United States from Wikipedia. Luckily, this map already has each state pre-labeled, so we can access and color it: a big time-saver. Otherwise, we would have had to go to our own U.S. map in Illustrator, bring each state onto it’s own layer, and name that layer with the abbreviation of the state. Once you’ve put the .svg file in a new folder, create a basic HTML file, or download the template we’ve provided. You’ll need to include jQuery and D3. For our purposes, you are simply going to copy and paste the contents of the SVG file into a div in your HTML file. If you’re using TextMate, you can just drag in the SVG to the proper place. You’re going to see a whole bunch of raw SVG, which makes up the map. Each <path> element is a state, and has an ID attribute that maps to the state abbreviation. The “d” attribute, which has “M”, “L”, and a bunch of numbers, actually contains all the coordinates of that state. With the SVG embedded in your HTML, if you open it up in a browser you should see a map. Unfortunately, this SVG file comes with each state already colored gray, and we want to assign our own colors. So we need to find and remove from the SVG all instances where the fill color “#d3d3d3” is defined. Now, when we view our page in a browser, the states come up black.  This map lives inside the DOM, and we can access each of the states by its ID. If you’re familiar with jQuery or web development, you can already imagine things you could create. One way to start out quickly is to simply manipulate one of those states, in jQuery it’s as simple as
$('#NY').css('fill', 'red')
Now we need our data, and we are going to use Google’s JSON data of the 2008 presidential election. Save the .json file and add it to your folder. If you open it up in TextMate, it appears as one long line, which makes it hard to understand the data you’re working with. If you copy that line to your clipboard and head over to JSONLint and paste your JSON into the field and hit “Validate,” it will reformat your JSON into a more readable format. You can paste that back into your JSON file. Look over your data and get a sense of what is available to you. You’ll notice in the very beginning they assign a unique ID number to each candidate, we will need this for later. To use this JSON you’re going to need to assign it to a variable for use in your main file. To do this, add
var statejson = [
to the very beginning and add
]
to the very end. That’s it. If you add
console.log(statejson)
to the end of your page, you can go to the console in Chrome and explore the structure of your data.  It looks like they store the winner in statejson.locals.STATENAME.races.President[”].final. You can find that out by getting more and more specific in your console.log and checking what is returned in the console in Chrome. You can test your theory by trying
console.log(statejson.locals.Alabama.races.President[''].final);
This should return the ID of the winner of Alabama, “1701.” Now we know where to get the data we need, we need it in a format that will help us make our map. To map the winner data to the paths in our SVG, we are going to need the abbreviation for each state. In another situation we might need to have a separate JSON file that would help us map our full state names “New York” to their abbreviations “NY,” but the election data includes the state abbreviations. You can find them in
statejson.locals.STATENAME.abbr
We are going to use these two pieces of data to create a whole new JSON object. We want that object to be very simple, and contain only two pieces of data: the state abbreviation and the candidate who won that state. But right now we only have the IDs of the candidates who won, so we need to write a little decoding function based on the information we got from the beginning of the JSON file.
function candidate_id_decoder(president){ // Decode president name based on codes // because our data doesn't just give us their names if(president == '1701'){ return 'McCain'; } else if(president == '1918') { return 'Obama'; } else { return false; } }
Using all of these pieces, we can now create our new data.
var state_data = []; $.each(statejson.locals, function(key, data){ // Grab the ID of the candidate elected president in that state var president = data.races.President[''].final; // Grab the abbreviation of that state var state_abbreviation = data.abbr; // Create a JSON object containing the state abbreviation // and the name of the president who won that state var datarow = {"state_abbr": state_abbreviation, "president": candidate_id_decoder(president)}; // Add that JSON object to our data state_data.push(datarow); });
Now we can check out the new data we’ve created by doing
console.log(state_data);
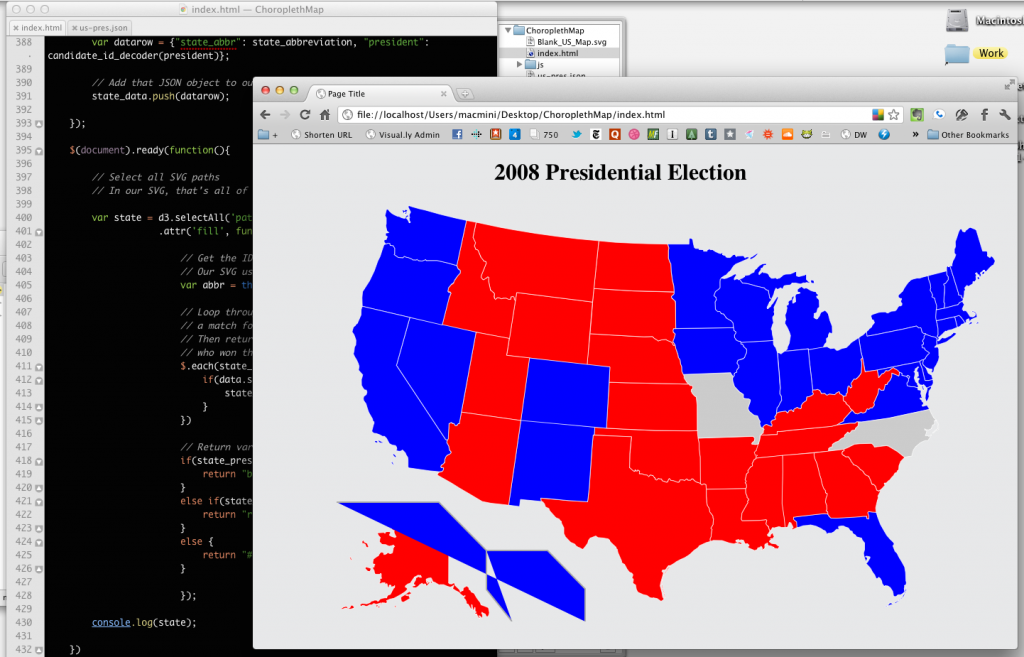
 Now that we have our data how we want it, let’s manipulate our SVG to make our map. We are going to use D3 to select all of the path elements on the page. In our case that’s each individual state. We’re going to change the fill attribute based on the ID of that path. So once we encounter the “AL” path, we’re going to look for our “AL” key in the data we made, and then return a different color depending on the candidate associated with that state.
var state = d3.selectAll('path').attr('fill', function(d){ // Get the ID of the path we are currently working with // Our SVG uses the state abbreviation for the ID var abbr = this.id; // Loop through the state data looking for // a match for that abbreviation // Then returning the corresponding president // who won that state, from the array we made earlier $.each(state_data, function(key, data){ if(data.state_abbr == abbr){ state_president = data.president; } }) // Return colors // based on data if(state_president == "Obama"){ return "blue" } else if(state_president == "McCain"){ return "red" } else { return "#CCC" } });
Refresh and you will see your data reflected in your SVG!  You’ll notice that South Carolina and Missouri have no fill color: it appears that the data is not formatted correctly for these states. If this were a real visualization, you would need to go in and correct that by hand (as you often do when working on projects like this). There is also a strange shape in the bottom left caused by some stray paths included in Wikipedia’s SVG file. You can delete them in the SVG in your main HTML file. EJ Fox is a staff designer at Visual.ly.