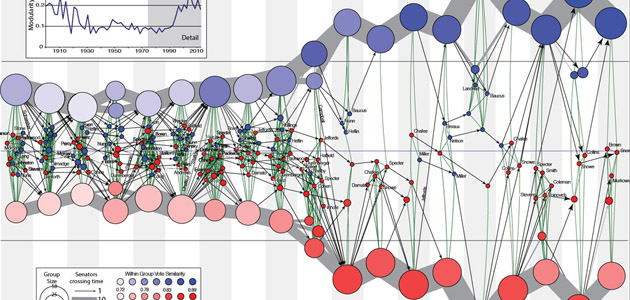
With the Republican-controlled House of Representatives and the Democrat-controlled Senate unable to compromise on a budget for the new fiscal year, the White House issued the order for federal government agencies to shut down until lawmakers can find a solution. All federal employees not deemed “essential” will have to stay home, services like issuing passports will come to a halt and the city of Washington, D.C., may even have to stop trash collection. Washington-area workers won’t be the only ones feeling the pain. National parks, monuments and federal offices around the country are shutting down as Congress agrees on a plan to continue funding the government. While there have been 17 government shutdowns since 1976, the general consensus among political observers is that the country is now the most politically polarized than it has been at any point in the last 30 years. This political polarization, helped along most recently by the rise of the Tea Party in 2010, and the incentivization of adhering to a staunchly partisan ideological agenda, has been a major contributing factor to the stalemate in Congress. Some Republicans are even lamenting that President Barack Obama is more willing to negotiate with Russia than he is with the GOP. So, how polarized are we now, and is it really worse now than it used to be? The three visualizations below offer some answers: This first comes from an academic study, “Portrait of Political Party Polarization” by James Moody of Duke University and Peter Mucha of the University of North Carolina, Chapel Hill. They measured “co-voting similarity networks in the US Senate and trace individual careers over time.” This resulted in a network map of which senators voted in coalitions with members of the opposite party, and how these cross-party coalitions have grown scarcer since the mid-1990s.

The next graphic shows the partisan makeup of the House of Representatives and Senate over time, and demonstrates the ebb and flow of different ideological wings of the parties. While the number of center-right and center-left politicians in the Senate is generally smaller now than in the early 90s, it is the House of Representatives that shows the most startling numbers. Starting in the mid-2000s, center-right members of the House become almost non-existent.

The Clear Congress project by Thomas Gibes shows a different type of network. The graphic tracks the legislation that the members of Congress sponsor and cosponsor, the ideology of that legislation and who they are sponsoring the legislation with. With few members of Congress near the center line, the graphic shows that they rarely cross the partisan divide to work on legislation with those of a different ideological bent.

For more analysis on the information in the graphic, be sure to check out Gibes’ excellent Clear Congress blog. Allison McCartney is an editor at the PBS NewsHour focused on education and informational graphics, and a freelance designer in the Visual.ly marketplace. She has a bachelor’s degree from Washington University in St. Louis, where she studied Middle Eastern history and art. You can follow her on Twitter @anmccartney.