Visually is committed to helping designers find and use great information design tools. We believe that a well prepared design community helps raise the quality of design work for everyone. In the past, web-based charting technologies have been out of reach for designers who didn’t know how to write javascript. This means designers with less tech savvy can have a hard time creating more complex charts and data visualizations. But those days may now be in the past. Belgium-based data storytelling startup Datylon has created a plug-in for Creative Cloud versions of Adobe Illustrator on Mac OS X that lets Illustrator users work with any SVG charts built with javascript. This includes charts built with D3.js, and the Highcharts library, with other sources coming. 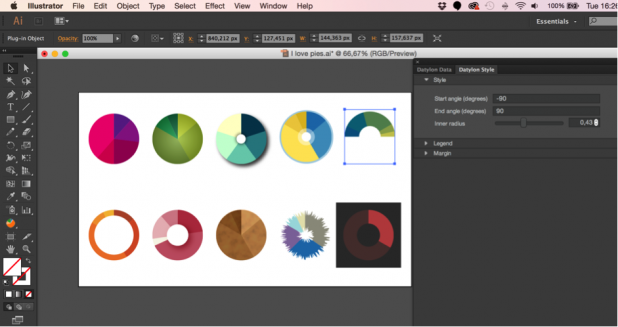 This alone would open up a multitude of possibilities, but it gets even better. The design components of the charts are easily available to the user to customize, even while the data is still modifiable. On top of that, Datylon built an online app where designs can be published. Their online platform allows the data to be edited in a completed design, even without access to Adobe Illustrator – a powerful feature for periodic reports. Designs published online can also pull data from a URL to a CSV or JSON file so that data can be kept up to date every time a design is loaded. “Datylon focuses on the last mile of the data supply chain,” said Datylon CEO and co-founder Erik Laurijssen. “Our platform helps users convert data insights into visually attractive stories that can easily be shared to boost information dissemination and understanding.”
 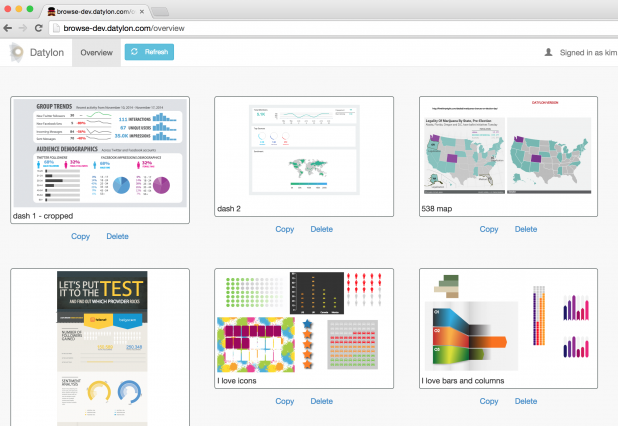 With that goal in mind, the plug-in currently supports the following charts:
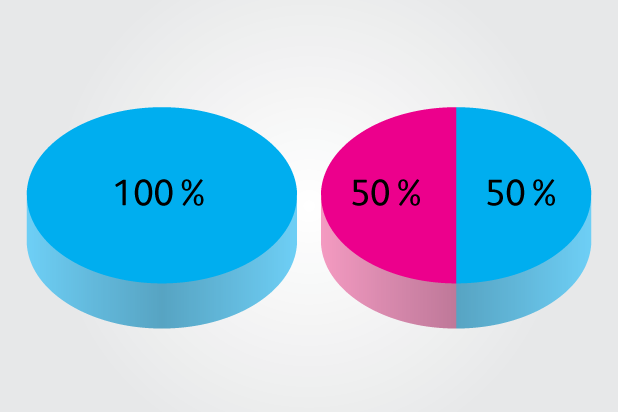
- Pie charts
- Donut charts
- Bar charts
- Column charts
- Icon charts
- Text
- World choropleth maps
- US choropleth maps
- Circular bar charts
- Area and Line charts
- Stacked Icon charts
- Icon Column charts
- Highcharts’ set of charts
- Highmaps’ set of maps