You surely know that data is essential to digital marketing, right? It allows you to create more efficient strategies because it brings valuable information about the market, your customers, competitors, and your own company.
However, Big Data presents us with a challenge: how to work with this infinity of data provided by the internet? Well, one of the ways to deal with this is to dedicate yourself to the field of data visualization, which organizes it visually and makes it usable to achieve your goals. Because of this, Google Data Studio can contribute to your business.
Google Data Studio is a powerful tool for creating reports and dashboards, which you can use to analyze, present marketing results, and make better decisions. Based on reliable data, it is possible to make more informed choices.
In this article, we will introduce the platform and explore all its possibilities in a complete tutorial. Learn about it all now:
Download this post by entering your email below
What is Google Data Studio?
Google Data Studio is a free tool for creating beautiful, customizable, interactive, and responsive dashboards. It is possible to build panels from templates, use the most diverse graphs, maps, and tables, apply your brand identity, and use other resources — all in a user-friendly way so that anyone can create and understand the reports.
Google Data Studio is a Business Intelligence (BI) tool, which transforms raw data into strategic information for companies. Through data visualization, Google Data Studio gathers metrics and indicators that support decision and strategy making, so that companies take fewer risks and achieve their goals.

Google Data Studio is part of the Google Marketing Platform toolkit, which offers several other resources to assist the marketing of small and large companies.
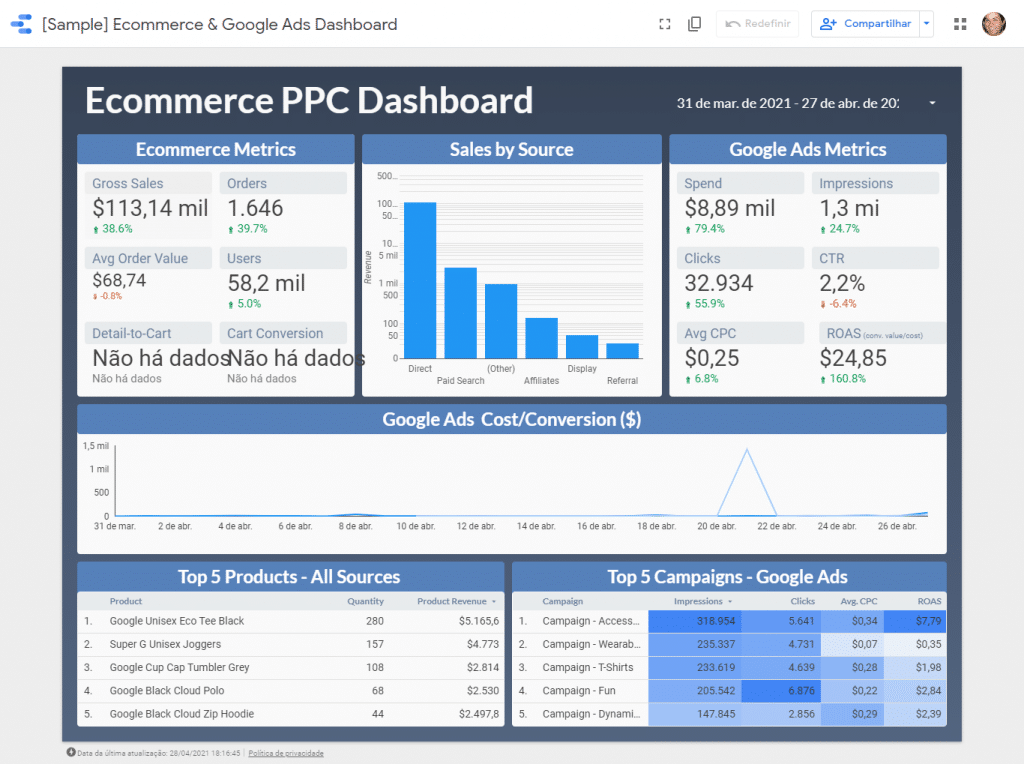
Below, you can see an example of a report that Google Data Studio can generate. It contains Google Ads metrics for e-commerce. By clicking on this link you can interact with the report — or even use it as a template to create your dashboard!
What is Google Data Studio for?
Google Data Studio can be used in several areas of a company. After all, business intelligence must permeate all fields and be present in the teams’ daily lives. Here, we focus on marketing, which needs to work with data at all times to understand the market, plan better strategies, and optimize campaigns.
But sales, finance, people management, and business administration departments also benefit from the tool, since they also need to keep an eye on performance metrics to guide their strategies.
Then, let’s check out what are the main uses of Google Data Studio, especially in the marketing field.
Analyze data
The creation of reports and dashboards in Google Data Studio is mainly for data analysis. In marketing analytics, it is important to have a tool that consolidates data from different sources to allow deeper analysis.
With this tool, you can evaluate data from your website, e-commerce sales, performance in paid media, engagement in social media, the growth of your competitors, among other elements.
Monitor performance metrics
Google Data Studio also allows you to monitor performance metrics for your strategies. Throughout a campaign’s course, the entire team can keep an eye on the marketing performance and optimize its aspects to reach better results.
And you can do this in real time, with data updated every second, allowing you to take quick steps to adjust your campaigns.
Display results
Google Data Studio reports are very visual, interactive and easy to understand. Because of that, you can also use them to present campaign and strategy results in order to prove the value of digital marketing.
You can share Google Data Studio dashboards with the team, managers and customers. They can interact with the graphs, change the date ranges, filter the data they want to view, download, among other actions.
Why using Google Data Studio is important?
Google Data Studio is among the Business Analytics tools that you can use. It is essential to group data from different sources and centralize them on a single platform to generate insights and support decisions.
BI tools allow you to have a broad view on the performance of digital marketing as a whole, not in separate channels. Generally, team members can collaboratively edit and interact with reports and customize the view with a variety of features. Users can also interact with the data, filter, download it and perform other actions.
That way, it is no longer necessary to keep sending static and bloated reports via email, which can get lost, become out of date and cause communication noise.
Google Data Studio stands out in some aspects. The main advantage is that it is a free tool, with numerous features offered by paid tools ones. In addition, it is a very intuitive and easy-to-use solution that will save you time in reporting. Also, you don’t need specific knowledge in BI, technology or design to create beautiful and efficient reports. It is different from other platforms, which require a longer learning curve.
Google Data Studio also offers integration with several other platforms. With Google’s own tools, such as Google Analytics or Google Ads, this integration is even simpler and more efficient. So it’s worth experimenting and seeing the benefits that Google Data Studio can deliver to your business.
How does Google Data Studio work?
Now, let’s see how this tool works in practice. We’ll show you all the details to get the best out of Google Data Studio.
In general, it works like this: the platform collects data from different platforms so that you are able to create graphs, tables and other visual representations. From there, you can work with metrics and dimensions to create dashboards according to your goals. Then, it is possible to share them with other users.
Google Data Studio is organized into four large feature blocks: integration, transformation, visualization and data sharing. Now, let’s understand better what are its main features. Check them out!
Data integration
Google Data Studio uses data connectors to collect information from other platforms and consolidate everything.
By clicking on this link, you can see all the data sources that can be connected. The most popular marketing platforms are covered, including Google’s own tools and partners. Some of them are:
- Google Analytics;
- Google Ads;
- Google Search Console;
- Google My Business;
- Google Sheets;
- YouTube Analytics;
- Bing Ads;
- Facebook Ads;
- MailChimp;
- HubSpot;
- Ahrefs;
- SEMrush;
- Shopify;
Data transformation
Google Data Studio’s second step is to transform raw data into more complete and meaningful information.
Loose numbers can be quite uninteresting and even confusing, right? Therefore, Google Data Studio tries to transform this data into more basic elements, which generate information for graphs and tables. Then, they become intelligence for your business.
To help you to do this, the tool offers an Explorer. This feature allows you to work with the data, add dimensions, apply mathematical functions, arithmetic operators and custom formulas to transform it into useful values.
With the Explorer, you can perform free experiments for further data analysis. It works like a notepad, to work privately, unlike reports, which are collaborative. It is also a good choice to familiarize yourself with the platform before creating proper reports.
Here, the more experience you add to marketing analytics, the more you can explore data to generate intelligence.
Data visualization
The data visualization consists in the creation of reports and dashboards. Here, the information is translated into graphs, tables, maps and other visual aids. Thus, it is possible to display the information in a more pleasing and understandable way.
When creating the panels, you can customize them as you like, according to your goals and branding. You can add logos, icons, shapes and images, change colors, choose other text fonts and edit properties to give your identity to the data. All of this can be done from themes and templates.
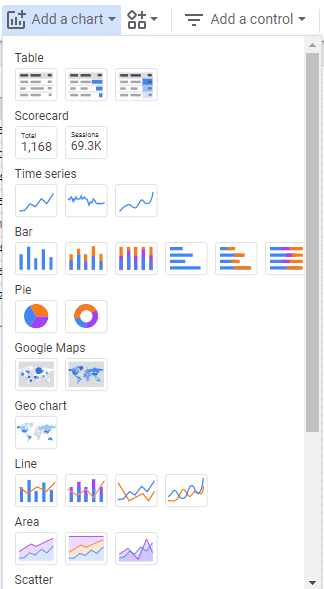
Google Data Studio offers the most diverse chart choices for reports, such as:
- tables;
- time series;
- bar graphs;
- pie charts;
- maps;
- areas;
- scatter plots;
- pivot tables.
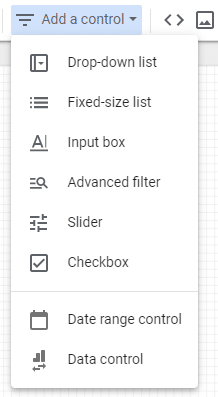
It is also possible to include data controls for those viewing the report, such as dimension filters (geographic area or source, for example), check boxes and period. That way, you don’t have to create several reports — it’s all there, just select it. In addition, the reports become more interactive and interesting for users.
Data sharing
Lastly, Google Data Studio allows you to share data and reports. You can invite other users to view or edit the dashboards, according to the level of access you’ve defined.
Collaboratively, other team members can work on the same reports. Changes are automatically saved, just like Google Drive works, for example. This allows for real-time collaboration.
You can also use sharing to send reports to clients or managers in order to present a strategy’s results. They receive notification by email to access the link and view the data, which is always up to date.
Tutorial: how to use Google Data Studio in 2023?
Now, let’s check out a Google Data Studio tutorial for you to learn how to explore this tool and use it in your digital marketing strategies. You will see how simple and intuitive the tool is. Here it is!
1. How to access Google Data Studio
First, to access to Google Data Studio, you must have a Google Account. After that, you can log in to the Google Data Studio website.
In the latest version, from April 2021, you will see a screen like this:
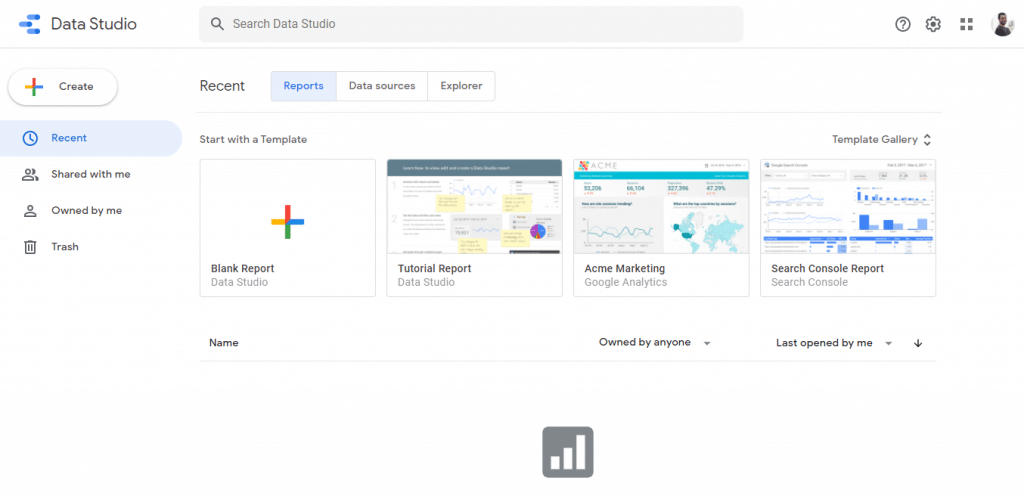
The menu on the left serves to navigate between the reports you have recently opened, which have already been created or shared with your user. The top menu allows you to navigate between Reports, Data sources and Files from Explorer.
2. How to add data sources
After getting used to the tool, you’ll probably want to know how to create a report, right? But first, try to define the data sources you want to work with. They will supply the reports that you create.
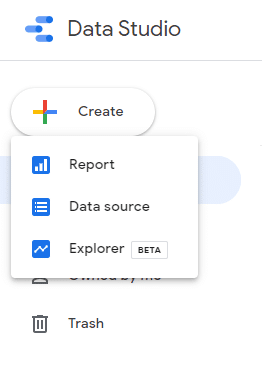
To do that, click Create > Data Source in the menu on the left.
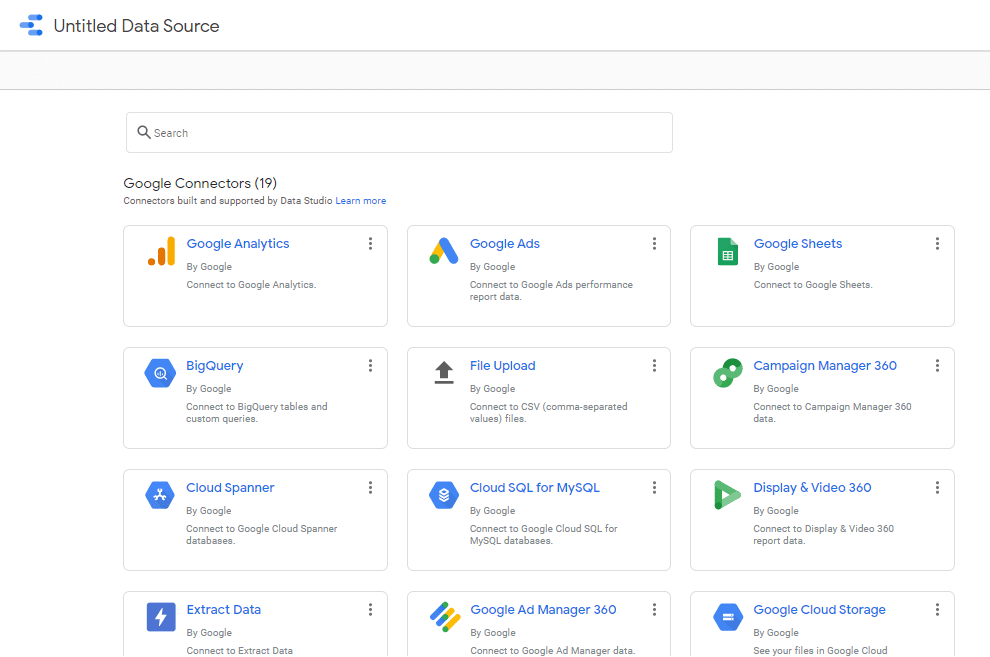
On the next screen, select the platforms you want to integrate with Google Data Studio. In the upper left corner, you can name your data source.
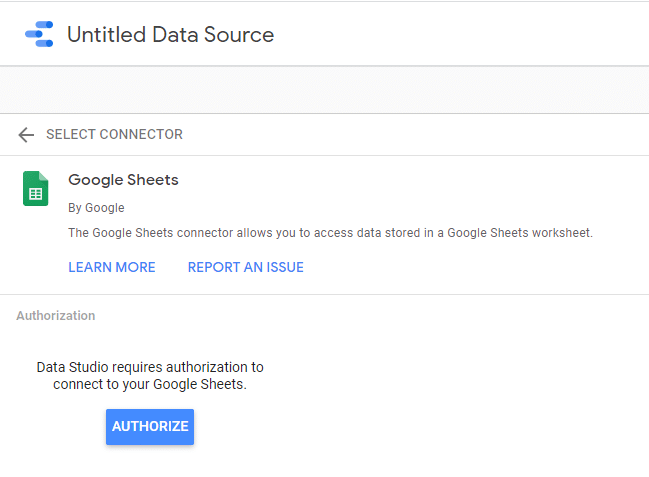
In the example below, we’ve chosen Google Sheets. When you click Authorize, Google Data Studio connects with the properties linked to your Google Account. Then, you can select the data and spreadsheets that should be collected.
After authorizing the connection, you will have a data source registered. From there, you can create a report or explore the data in Explorer.
3. How to create a Report in Google Data Studio
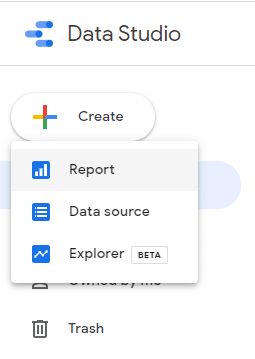
Now, let’s see how to create a report. After adding the Data Source, you can now click on the “Create report” button, or go back to the Google Data Studio home. In the menu on the left, click Create > Report. You can choose a template from the gallery.
On the next page, Google Data Studio already asks you to select the data sources for the report. If you’ve already added them as it’s shown above, go to “My data sources” and select them. If not, it is possible to connect them at that time.
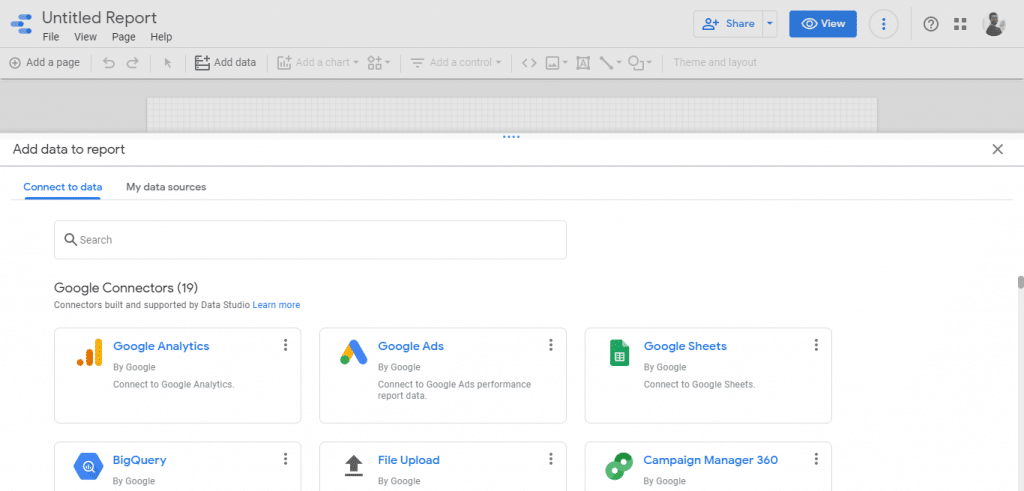
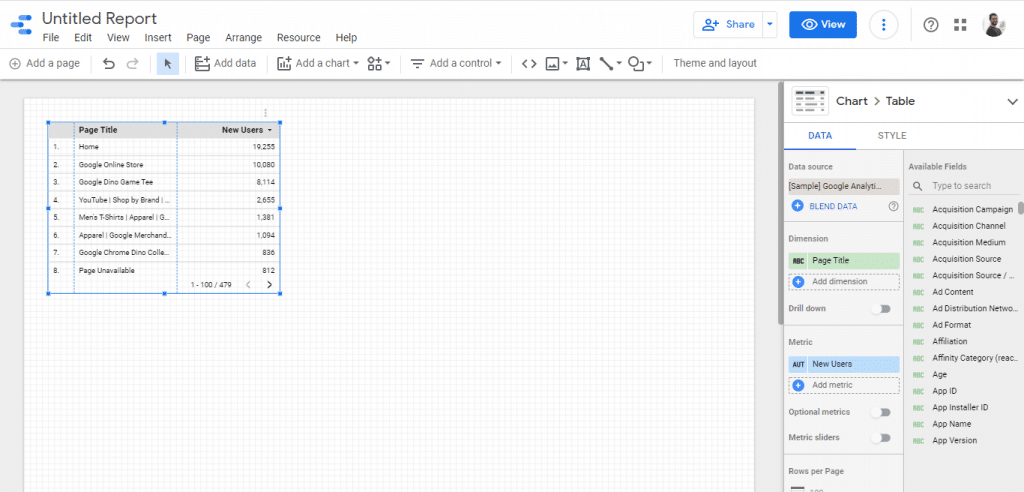
After you’ve selected the data source, Google Data Studio will display a page like the one below. From there, you can create the report the way you want, add graphics, shapes and text, change the layout, and others actions. If you start from a template, the report will already be more complete — just edit the data and customize it as you wish.
In the column on the right, you can find the available chart options, in addition to the data source metrics and dimensions, which can be combined and crossed to generate more interesting information in the report.
In the report’s top menu, you can find several editing options. For example, it is possible to click on “Add a chart” and see all the possibilities.
You can also click on “Add a control” to insert dynamic control options by the user viewing the report.
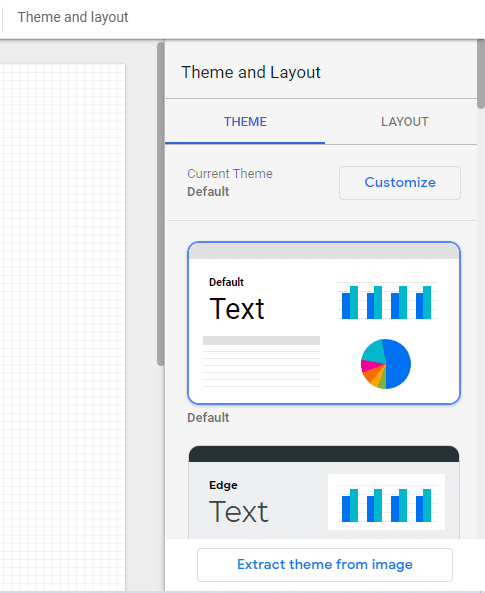
At the end of the menu, you will also find the Theme and Layout options. They allow you to customize the report as you prefer.
Note that, in the top menu, you can edit the report name, in addition to accessing all editing and viewing options. On the right, there are also buttons to make a copy of the report, update the data, share and view it.

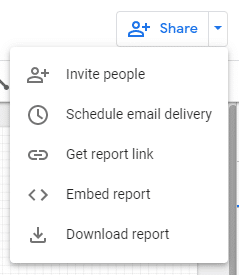
By choosing Share, you are able to invite other users, send by email, copy the link, embed the report or download it in PDF.
4. How to use Explorer
Explorer is still in beta, so some features may be limited. As we explained earlier, Explorer is aimed to experiment, work with the data, make analyzes and then go ahead wih the reports.
You can use it to explore the data of some channel, add dimensions and do more in-depth analysis. It is not a mandatory step before creating a report, but it works well as a draft and can still generate more powerful insights.
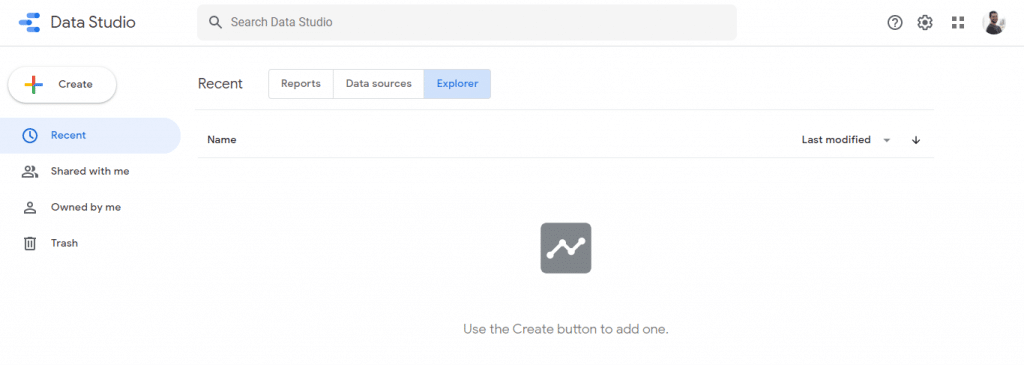
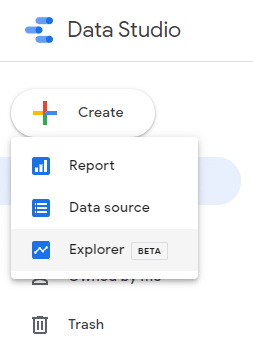
So, to use Explorer, go to the Google Data Studio home and click Create > Explorer.
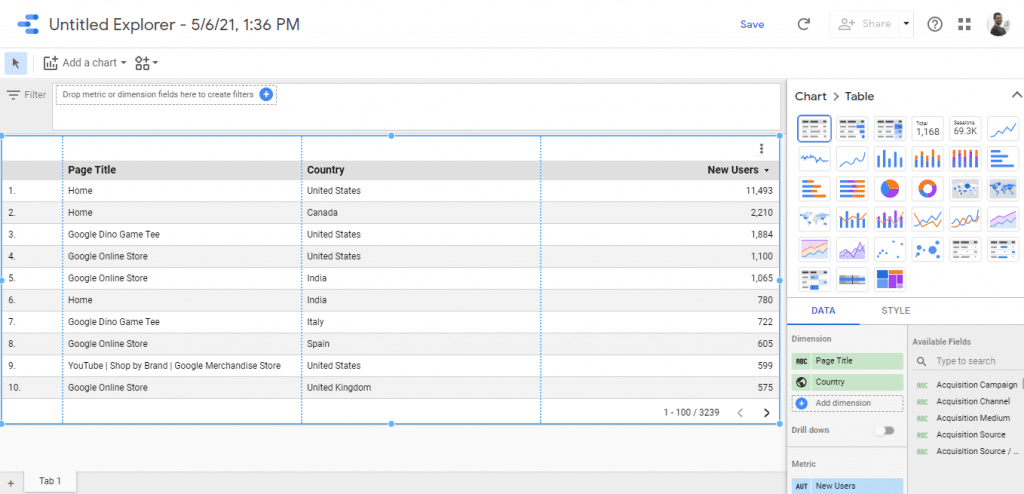
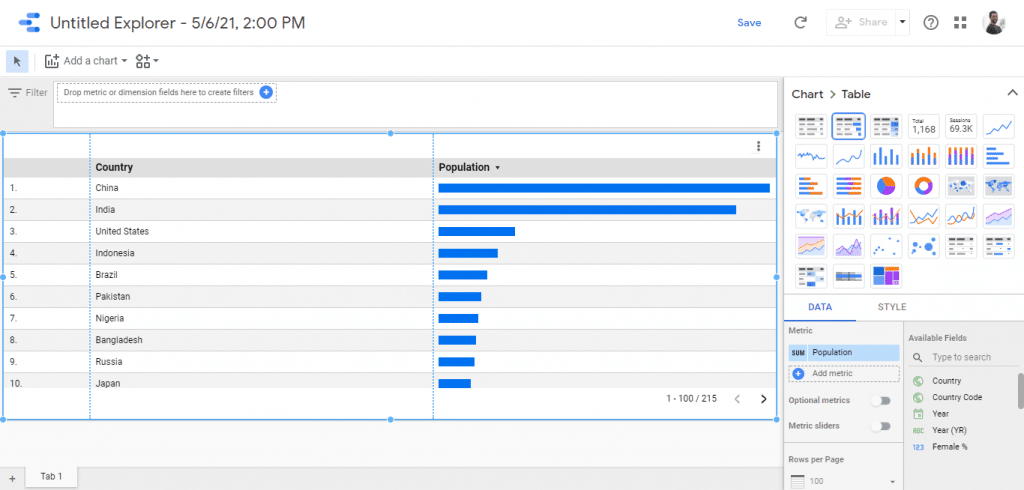
Next, you will see a blank page, prompting you to add a data source to start exploring.
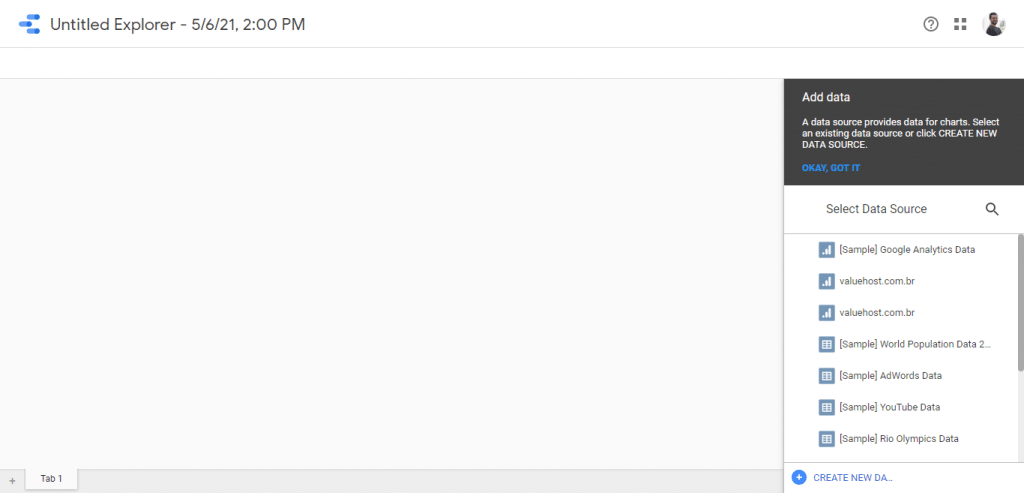
When selecting one or more data sources, you will see the chart options in the menu on the right, as well as the data, dimensions and styles you can use.
To filter the chart data, drag the dimensions and metrics you want to work with from the Available Fields panel on the right to the filter bar at the top.
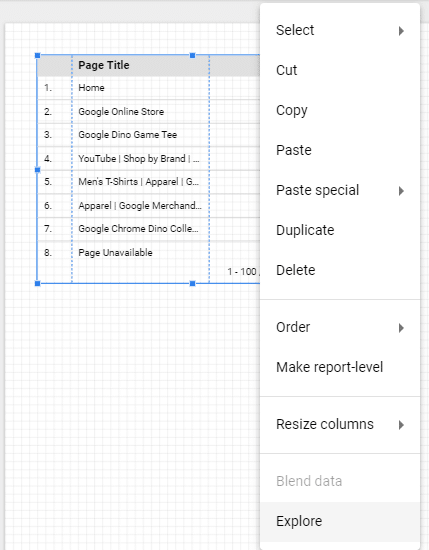
You can then copy the chart to an existing report or create a new one from the Explorer area. Click the Share button to check the options. You can also use the Explorer from a Data Source or a Report. In the data source settings, for example, click the Explore button and start creating charts and working with the data.
In a report, on the other hand, you may be interested in exploring more specific graphs, see how it feels to add a new dimension or combine it with other data, for example. Then, right-click on the graph and go to Explore. Then, Google Data Studio opens a new Explorer you can work in.
Now you know how to get started with Google Data Studio. Our tutorial showed you how to access the tool, integrate other platforms, create your first reports and explore the data for better analysis.
If you want to save time and create more understandable and beautiful reports, Google Data Studio can be a great partner! In data-driven marketing, this type of tool is essential for teams’ day-to-day activities and decision-making.
Now, take the opportunity to also understand how interactive content can impact your overall marketing performance. Download our free ebook!

![[ROCK NA] [EBOOK SEO] Complete Guide](https://rockcontent.com/wp-content/uploads/2024/06/banner_Search-Engine-Optimization.png)