
In the post-Facebook, Twitter and Google world, Internet users can be easily organized into a social graph: a web-like visualization of interconnected users that shows how each user is related to the next. At University of Cologne in Germany, student and film buff Michael Schober went to a lecture on social network analysis and began thinking about the various ways social graphs could be used to describe the world.
Download this post by entering your email below

“I was absolutely fascinated by the way you could map information in a single graph and thereby give it a unique angle of view,” he said. After watching Babel later that week, Schober thought he had spotted the movie’s social graph organization straight away. “That’s where I thought it would be cool to extract the social graph from the movie script for a bunch of movies, and wrote a parser that extracts the connections between the characters.” Halfway across the world, at MIT in Cambridge, collective intelligence student Jermain Kaminski was introduced to Schober through a mutual friend. Soon after the two began connecting, Movie Galaxies was born. The pair perfected a custom algorithm that analyzes scripts and visualizes character interaction into a social graph.

Since the project was presented at the COINS Conference 2011, Movie Galaxies has captivated computer scientists, social researchers, and movie fans alike. The site currently contains a database of 775 movies from classics like Citizen Kane to modern hits such as Hot Tub Time Machine.


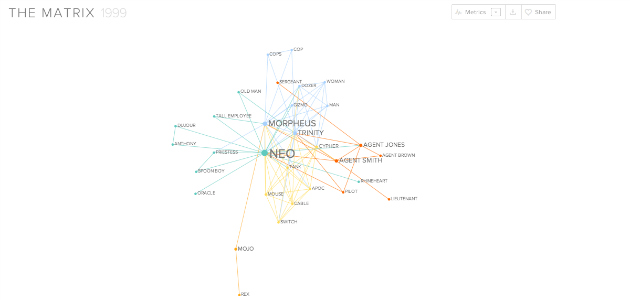
The Movie Galaxies parsing algorithm identifies which characters are in which scenes, which characters are engaged in conversation together, and how often they communicate. Since movie scripts follow strong style guidelines, identifying the structure using Python was “pretty straight forward,” said Schober. The project uses three main metrics to show interconnectivity – betweenness, degree, and cluster. The best way to understand these is to simplify a movie’s relationship to an A-B-C connection, said Kaminski. “Betweenness tells you about the importance of actor B, being “between” A and C. Degree tells you mostly about the number of connections one character has. For example, actor B has two connections, while A and C only have 1 each (which is B). And clustering tells you about “sub-networks” within networks and how cliquish it is.”

Movie Galaxies’ strength lies in its uniqueness and simplicity. By translating complex social relationship data into an interactive graph, users can get a quick, high-level overview of a movie’s social organization without every having to turn on the TV. “One thing most people say is that Movie Galaxies is just a very unique and easy way to look at a movie,” Schober said. “If I had 30 seconds to explain a movie to a complete stranger I would use Movie Galaxies because it is a 10,000 feet view on the story.”

Added Kaminski, “The web-like structure is a great way to display this information and to convey the idea easily. Technically, our focus in terms of responsiveness was to create a site that allows you to browse through as many movies as possible within in a short time. Thus, we had a close eye on minimalism, page-load and click-through, to give the user a full focus on the graph.” Movie Galaxies has been used in two online Coursera classes, in lectures at MIT and Stanford, and was suggested in a recent paper as a way to teach network science to teenagers. While both co-founders have been busy with other projects, they have continued to improve the parsing algorithm and hope to add five to 10 movies each month. More information about the project can be found at MovieGalaxies.com and on Twitter @MovieGalaxies. Jon Salm is an associate client analyst at Millward Brown Digital in New York City and a freelance data journalist in the Visual.ly marketplace. He has a bachelor’s degree in English from Washington and Lee University. You can find him online at about.me/salm.jon and follow him on twitter @S4LM3R.


![What does a Lead Generation Specialist do? [+ How to become one]](https://rockcontent.com/wp-content/uploads/2021/12/Lead-Generation-Specialist-300x158.png)
