Plotly is a new charting tool built with designers in mind. It provides an easy way to get the raw chart visuals needed for all kinds of visual content. Plotly is a data analysis and graphing web app that lets you make precise and beautiful charts. Its like Tableau or Excel, but online, free, and far more flexible. Charts from conventional desktop programs can have a distinct look that’s tough to integrate with the aesthetic presentation of the rest of your content. As a data-driven designer or journalist, you want freedom in layout, colors, and chart elements, but quantitative precision, too, and we’re here to help! If you’re a designer on Visually, you can use Plotly to create the “chart” part of your visuals. Plotly gives you the precision needed for data-driven graphics, without getting in your way, so you don’t have to spend hours lining up rectangles in Adobe Illustrator. If you’d rather stick with your favorite desktop graphics editor, no problem — you can create only the “bar” part of a bar chart in Plotly, then do the labels, typography, and everything else in the program of your choice. Plotly charts can be downloaded as SVG, EPS or PNG, so they are simple to import into Illustrator, Photoshop, AfterEffects, or Keynote. If you’re not a programmer, but want flexibility and richness not provided in other online graphing tools, you’ve come to the right place. Plotly was built on d3.js, a javascript library built for creating data visualizations. Plotly is perfect if you’re not a coder, but want some of the flexibility and richness that d3.js affords. If you create data-driven visual content for the web, Plotly charts can be embedded to take advantage of their interactivity – there are hover text, panning, and zoom controls, as well as real-time data streaming options. You can see Plotly charts used by the Washington Post here. Below are some example charts created by Plotly users.
Infographic-y Charts
This Plotly chart is almost its own infographic. It could be integrated into a larger print or web infographic about space exploration.
Super Simple Charts
In Plotly, you can strip a chart to the bare minimum, then do the rest of the design in Illustrator or Photoshop. Here is a bar chart where everything except the bars have been removed.
Colors!
Plotly has an infinite selection of colors. You can choose colors of all chart elements by RGB value to be sure that they match the rest of your presentation.
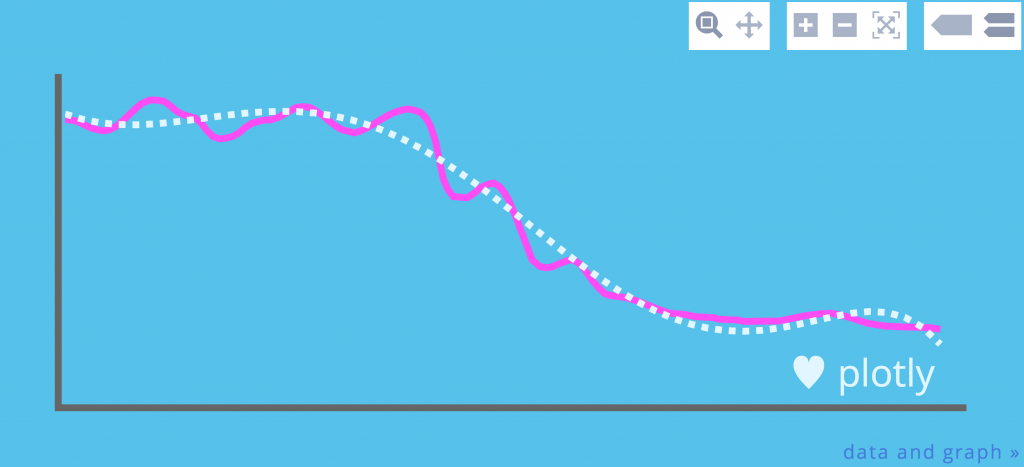
Charts Streaming Live Data
Plotly charts can stream live data! The chart below updated itself every 5 minutes from January 9 to 12. If you’re interested in making dynamic Infographics with Plotly charts, check out this Instructable on streaming data to Plotly.
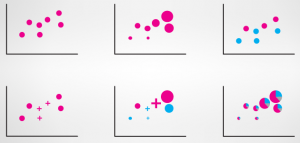
Bubble Charts
Bubble charts can be a pain because sizing the bubble is tricky. Plotly takes care of calculating the precise bubble size and position for you, so you can focus on everything else. If your bubble chart is on a website, you can add hover text like this one. Plotly is free and online, so check it out and let us know what you think. You can follow us on Twitter @plotlygraphs, or email me, Jack, at jack [at] plot [dot] ly.