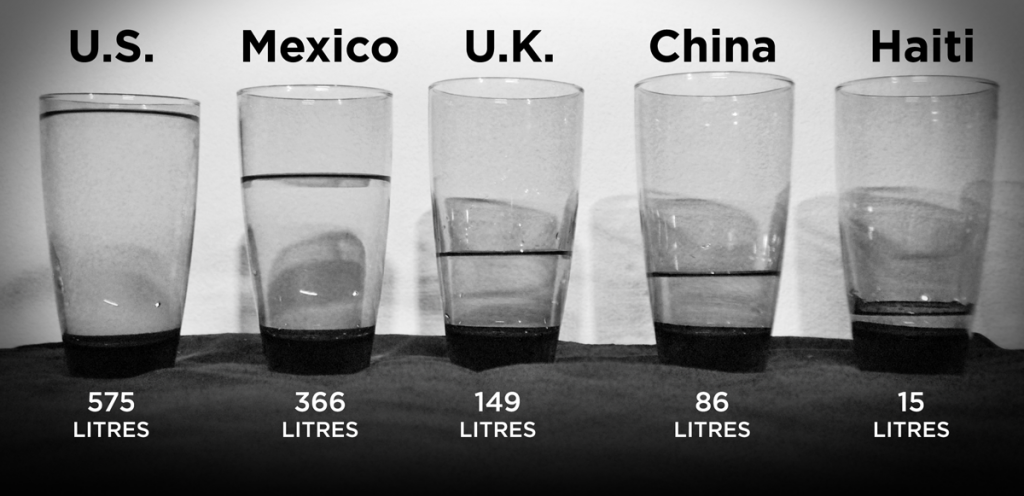
Real-world infographics, analog data visualization, physical visualization… there’s no official term for it yet, but the idea of visualizing data away from your computer is taking off — and anyone can do it. Artists create bar charts that span the height of a brick wall, or area charts with balloons blown up to varying sizes. These visualizations, when artfully photographed, can add intrigue to a simple piece of data. It’s one thing to see bar charts for average daily water consumption per capita in the United States, Mexico, the United Kingdom, China and Haiti…  … it’s another to see those bar charts shown as cups of water filled to different levels.
  These visualizations can draw the viewer in, provide a better understanding of the topic, and as long as the tried-and-true principles of data viz are respected, they can be a powerful tool. (Plus, they’re fun to make.) An important thing to consider: for real-world visualizations to really work, the physical visualization must add to the content of the infographic. For example:
- data on baseball fan attendance visualized by having fans hold up signs to make a bar chart;
- data on declining police budgets visualized as a bar chart traced in the dusty rear window of a police cruiser;
- data on holiday sales made by stacking presents in piles of varying heights in front of a christmas tree to make a bar chart;
- balloons filled to different sizes to show the declining reserves of helium…
- not to mention the near-infinite possibilities for proportion-related visualizations you are confronted with every time you eat a pie.
(Want to give any of the above ideas a try? Send us pics, we’ll be sure to feature them on our blog!) These visualizations are interesting because as humans, we are not yet hardwired to understand and compute the things we see on screens and on paper. We are built to understand the real world, and we are very good at evaluating the things in it, and this lends an immediate grasp of the subject that rectangles on a screen sometimes can’t imitate. But real-life visualization has its risks. As visualizers, we must be careful not to lie through carelessness. We are spoiled with the ease in which we transport data from computer to computer, and from spreadsheet to chart. When we create these visualizations, we must maintain proportion the old way, by hand. In those water-cup bar charts, the water should be measured in a measuring cup and be based on a scale that maintains proportions. Obviously, this is not an exacting science: most people will not be able to see minute mistakes. But the point is to always be as close as possible to the data, and one easy way to do it is to actually have a chart made in a charting program to double-check against your real-life visualization. If something seems disproportionate between the two charts, make sure you are not mis-representing the data in your physical visualization. It’s also important to focus on the photography of the real-world data visualization once it is complete. Get it in good light, whether that’s outside, or from a collection of lamps or professional photography equipment indoors. Keep the photo free of distractions, people, or photoshop them out later. You don’t want extraneous elements confusing your visualization. Take your picture and add some explanatory text, a source, and a title in an image-editing program. Then upload it to Visual.ly and link to your post in the comments, so we can all appreciate it.