About a year ago, we published a blog post framed as a letter to NASA, asking them to stop using rainbow color scales. The post was written out of a general frustration with rainbow color scales, but especially out of seeing field experts and leaders, like NASA, using a perceptually incorrect color scale. We weren’t alone. Robert Simmon from NASA’s Earth Observatory has been crusading for the same changes. He’s made great progress, and as a continuation of that, he’s responding to our “letter” with a brilliant series of blog posts on proper use of colors and color scales.
There are several types of data, each suited to different types of display.
Continuously varying data, called sequential data, is the most common. In addition to sequential, Cynthia Brewer defines two additional types of data: divergent and qualitative.
Divergent data has a “break point” in the center, often signifying a difference. For example, departure from average temperature, population change, or electric charge.
Qualitative data is broken up into discrete classes or categories, as in land cover or political affiliation.
Sequential data (discussed in depth in my previous post, The “Perfect” Palette) is best represented by color palettes that vary evenly from light to dark, or dark to light, often with a simultaneous shift in hue and/or saturation.
![]()
Sequential data lies along a smooth continuum, and is suited to a palette with a linear change in lightness, augmented by simultaneous shifts in hue and saturation.
Divergent Data
Data that varies from a central value (or other breakpoint) is known as divergent or bipolar data.
Examples include profits and losses in the stock market, differences from the norm (daily temperature compared to the monthly average), change over time, or magnetic polarity.
In essence, there’s a qualitative change in the data (often a change in sign) as it crosses a threshold.
In divergent data, it’s usually more important to differentiate data on either side of the breakpoint — increase versus a decrease, acid versus base — than small variations in the data.
Bipolar data is suited to a palette that uses two different hues that vary from a central neutral color.
Essentially, two sequential palettes with equal variation in lightness and saturation are merged together.
This type of palette works because it takes advantage of pre attentive processing: our visual systems can discriminate the different colors quickly and without conscious thought.

Divergent palettes, each composed of two sequential palettes merged with a neutral color. (Derived from the NASA Ames Color Tool (top) and Color Brewer.)
For the most part use white or light gray as the central shade. Although neutral, black or dark gray is typically a poor choice because the most extreme values will be light and desaturated, deemphasizing them.
Central colors with a hue component, even a slight one, will tend to be associated with one end of the scale or the other.

A magnetogram is a map of magnetic fields, in this case on the surface of the Sun. A divergent palette suits this data because the north polarity (red) and south polarity (blue) are both measurements of the same quantity (magnetism), just with opposite signs. SDO HMI image adapted from the Solar Data Analysis Center.
I find it much more difficult to design divergent palettes than sequential palettes. There’s a limited number of color pairs that allow strong contrast simultaneously in both hues.
If the colors converge too abruptly, high-contrast “rivers” of white may appear in the visualization when quantities are near the transition point.
Even worse, about 5 percent of people (almost all of them men) are color blind, and will have a difficult time seeing the difference in certain hue pairs, particularly red-green (more rarely blue-red).

Despite our best intentions, the Earth Observatory long used a vegetation anomaly palette that was completely unreadable by color blind viewers. Compare the full color palettes to what a color deficient viewer would see (derived from Adobe Photoshop’s deuteranopia simulation).
A sequential palette that varies uniformly in lightness will still be readable by someone with color deficient vision (or a black and white print), regardless of the hue.
But a divergent palette with matched lightness can be difficult or impossible to parse if the viewer can’t distinguish the hues. T
o ensure your designs are accessible, choose from the color blind safe palettes on Color Brewer, or one of the online color blindness simulators.
Despite these difficulties, divergent palettes are worth using. In many cases, especially for trends, a difference map using a divergent palette is much more effective than an animation or even a sequence of small multiples.
Categorical Data
Qualitative data (occasionally known as categorical or thematic data) is distinct from sequential and divergent data: instead of representing proportional relationships, color is used to separate areas into distinct categories.
Instead of a range of related colors, the palette should consist of colors as distinct from one another as possible.
Due to the limits of perception, especially simultaneous contrast, the maximum number of categories that can be displayed is about 12 (practically speaking, probably fewer).

These two qualitative color schemes—from I Want Hue (top) and Color Brewer (lower)—each consist of 12 distinct colors.
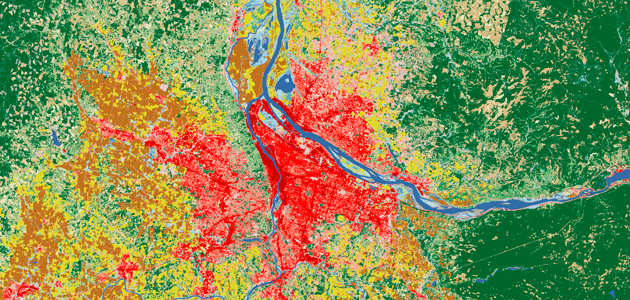
If you need to display double-digit categories, it’s best to group similar classes together. This is how the United States Geological Survey presents the 16 classes of the National Land Cover Database.
Four urban densities are shown in shades of red, three forest types in shades of green, and different types of cropland in yellow and brown.

A grouped color scheme allows the USGS to simultaneously show 16 different land cover classes in a single map of the area surrounding Portland, Oregon.
For even larger numbers of categories, incorporate additional elements like symbols, hatching, stippling, or other patterns.
Also, label each element directly. It’s impossible to distinguish dozens of colors and shapes simultaneously.
Geological maps can have more than 100 categories, yet remain (somewhat) readable.
Robert Simmon is a data visualizer and designer for NASA’s Earth Observatory. With 19 years of experience at NASA, he is an expert at creating clear and compelling imagery from satellite data. Robert focuses on producing visualizations that are elegant and easily understandable, while accurately presenting the underlying data. His imagery appears regularly in newspapers, web sites, and advertisements, and was featured on the login screen of the first Apple iPhone. Robert blogs about design and visualization on Elegant Figures and tries to keep track of the zeitgeist (and share the occasional dog photo) via his Twitter account, @rsimmon.