Motorsport is one of the world’s most popular spectator activities, and one of the most data-heavy. While the average three-hour baseball game can generate three million data points, a one-hour car race can generate well over 8 million. All these data points are the result of telemetry systems that can use more than 100 sensors on each car to generate read-outs of information, including gears used, throttle and brake application, g-forces and the temperature and pressure of various car components. In all, it is possible for a car’s sensors to transmit more than 10,000 readings per second that are then relayed in real time to a team of analysts in the pits, who use the data to make recommendations to the driver.
Download this post by entering your email below
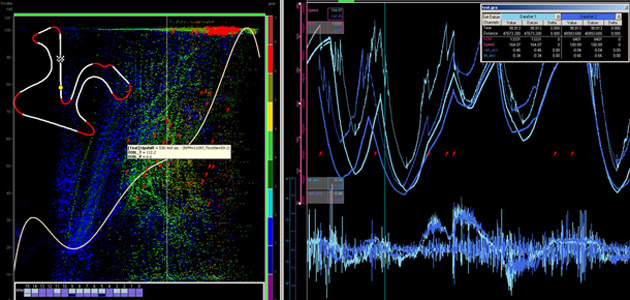
RaceCapture, a telemetry system that serves racing enthusiasts, uses 24 sensors that can each report data up to 100 times per second — or, as mentioned above, more than 8 million data points generated in an hour.  “Combining the data from sensors together can create virtual channels,” Fred Schechter of Autosport Labs, the maker of RaceCapture, wrote in an e-mail. “With these virtual channels we can contextualize data and create a bigger picture of what’s happening on the track for the driver and the vehicle.” When looking at a screen of the RaceCapture software in action, you might see something like the image to the right. “Those colored lines are the X-yellow, Y-red, and Z-blue accelerometer values respectively,” wrote Schechter. “These indicate which way the car would be “pitching”. In other words, when Y changes its going from acceleration to deceleration, and vice versa.” The main green line represents the speed of the car. Smaller charts monitor the car’s safety and health, including heat and pressure ratings, then allow the team to adjust the car accordingly. With these kinds of measurements, Schechter writes, “We often use sparklines to be able to see trends in combination with a live gauge to identify the current status.”

While much of these data are needed immediately to keep a driver safe and successful on the track, much more is downloaded after the race for review. Looking at a visualization of the data after a race can help drivers learn how they can improve for the next race. “Faster race car drivers are one of the most inexpensive upgrades a race team can have that many people simply overlook in the desire for the latest speed parts,” writes Schechter. Overlaying two telemetry charts can offer insight into the minute differences in braking and acceleration that allow winning drivers to get the edge.

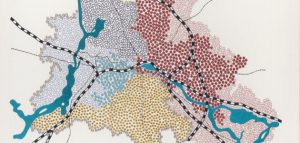
Traqmate, another telemetry system writes in its user manual that “often you can get a quick idea of a driver’s skill by simply looking at their Friction Circle plot.  These charts measure braking and steering. When a plot looks like the one on the left, almost like a playing piece in a game of “Sorry!”, the dips indicate it is braking, then turning: an amateur move. The expert driver on the right has almost all of their data points around the perimeter of the triangle. Different telemetry systems produce different outputs, ranging from simple to complex and beautiful, though all are strictly utilitarian. ATLAS, or Advanced Telemetry Linked Acquisition System, is one of the most popular systems among F1 racing teams. Developed by McLaren Electronic Systems, the software can display images like this:
  While telemetry systems used to be priced exclusively for the pros, kits like RaceCapture and Traqmate make data visualization for the racing geek (or maybe even racing for the data visualization geek) available for the individual consumer.