Customize Consent Preferences

We use cookies to help you navigate efficiently and perform certain functions. You will find detailed information about all cookies under each consent category below.

The cookies that are categorized as "Necessary" are stored on your browser as they are essential for enabling the basic functionalities of the site. ... 

Always Active

Necessary cookies are required to enable the basic features of this site, such as providing secure log-in or adjusting your consent preferences. These cookies do not store any personally identifiable data.

No cookies to display.

Functional cookies help perform certain functionalities like sharing the content of the website on social media platforms, collecting feedback, and other third-party features.

No cookies to display.

Analytical cookies are used to understand how visitors interact with the website. These cookies help provide information on metrics such as the number of visitors, bounce rate, traffic source, etc.

No cookies to display.

Performance cookies are used to understand and analyze the key performance indexes of the website which helps in delivering a better user experience for the visitors.

No cookies to display.

Advertisement cookies are used to provide visitors with customized advertisements based on the pages you visited previously and to analyze the effectiveness of the ad campaigns.

No cookies to display.

Turn Your Website’s Google Analytics Report into an Infographic

Updated: September 14, 2021

Need content for your business? Find top writers on WriterAccess!

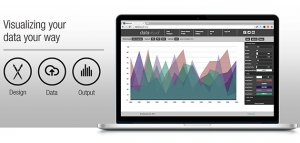
At Visually, we’re obviously big believers in making things more visual.

Hell, we even named our company accordingly. But it isn’t all about eye candy.

The most utilitarian of work-a-day tasks can benefit from a fresh coat of paint and an attempt to simplify and clarify information.

That explains why we recently turned our attention to Google Analytics.

More than 10 million people rely on this free tool daily to keep track of their website’s performance. It works well and we use it ourselves. But, with our experience in designing data-rich visual experiences, we knew it could be better.

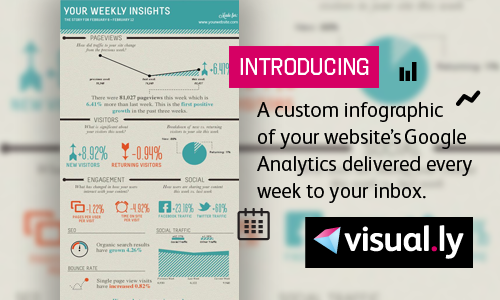
Instead of requiring you to log-in to a website, Visually Google Analytics Report is automatically delivered to your inbox each week.

And instead of an intimidating dashboard approach to analytics, it tells the story of key metrics such as the number of page views, social engagement, SEO, and bounce rate in a more visual way — highlighting the areas a site administrator needs to focus on in order to see improvement.

Visually Google Analytics Report isn’t intended to replace your existing dashboard. But we think it’ll save you plenty of time and (at least if your numbers are up) put a smile on your face.

We’re seeing more companies like Syspen turn to tools like this to make their internal data more understandable.

Whether you want to illustrate a research paper, explain a business process with visuals, or produce a motion graphic, Visually can help.

Visually Google Analytics Report is just the latest example of the kind of infographic available in Visual.ly Create, our free tool that generates automated infographics from social media and other kinds of data.

Visit Visual.ly Create to get started.

Share
facebook
linkedin
twitter
mail

Human Crafted Content

Find top content freelancers on WriterAccess.

Human Crafted Content

Find top content freelancers on WriterAccess.

Subscribe to our blog

Sign up to receive Rock Content blog posts

Rock Content WriterAccess - Start a Free Trial

Order badass content with WriterAccess. Just as we do.

Find +15,000 skilled freelance writers, editors, content strategists, translators, designers and more for hire.

Want to receive more brilliant content like this for free?

Sign up to receive our content by email and be a member of the Rock Content Community!

Talk to an expert and enhance your company’s marketing results.

Rock Content offers solutions for producing high-quality content, increasing organic traffic, building interactive experiences, and improving conversions that will transform the outcomes of your company or agency. Let’s talk.