Using Selections in D3 to Make Data-Driven Visualizations

See what 1400+ marketers had to say about the top marketing trends for 2024.

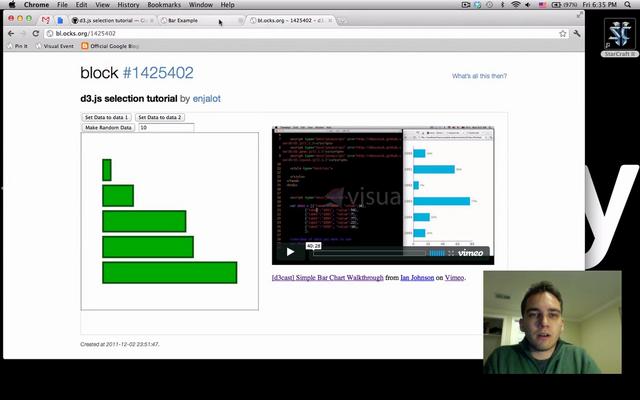
D3 is a new tool for designers and programmers working on creating interactive visualizations out of large data sets. We recently told you how to create choropleth maps in D3 with an easy, step-by-step tutorial. In this short video, we’ll go over the basics of using selections with d3.js to make data-driven visualizations. Interested in learning more about d3? Visual.ly’s next meet-up in San Francisco, The Introductory D3 Workshop for Beginners, is taking place on Thursday, February 16.  The event is booked up and the wait list is filling up quickly, but you can check back in for a live stream — or look for a recap here on our blog in a few days. [dd3] Selections in d3.js with a simple bar chart from Ian Johnson on Vimeo. Ian Johnson is a senior software engineer at Visual.ly

Share
facebook
linkedin
twitter
mail

2024 State of Marketing Report

Your golden ticket to crush your goals with data-driven insights!

2024 State of Marketing Report

Your golden ticket to crush your goals with data-driven insights!

Subscribe to our blog

Sign up to receive Rock Content blog posts

Rock Content WriterAccess - Start a Free Trial

Order badass content with WriterAccess. Just as we do.

Find +15,000 skilled freelance writers, editors, content strategists, translators, designers and more for hire.

Want to receive more brilliant content like this for free?

Sign up to receive our content by email and be a member of the Rock Content Community!

Talk to an expert and enhance your company’s marketing results.

Rock Content offers solutions for producing high-quality content, increasing organic traffic, building interactive experiences, and improving conversions that will transform the outcomes of your company or agency. Let’s talk.