There is a lot of buzz around people having much more data available and how that can help us improve our lives. One example is exercise tracking. It wasn’t long ago that exercise tracking had to be done manually: a stopwatch time and route distance were as much detail as you could get. With the advent of GPS devices, our options dramatically improved. And now, we have smartphones that use GPS technology to make exercise tracking and analysis even easier. There are several services tailored specifically for tracking fitness activities. They have different selling points, but at their core, they all take your exercise data and aim to provide you with helpful insights from it. One of the best ways to gain insights from data is, of course, using visualizations. And many of the visualizations those services provide are very similar or even the same. This is a good thing because it means they have probably converged on the most appropriate visualizations for the task and data. They all offer maps of activities and line charts showing other variables. Despite the similarities, though, some minor differences that set them apart. This week, I tested five such services by taking a quick bike ride on my local greenway and recording the data with an Android phone. I used the RunKeeper and Trimble Outdoors apps, and then uploaded the gpx files generated by those apps to three other websites. This was done to limit the load on the phone during the activity, but if you can use either of those five programs directly. What follows are links to my activity maps and a brief analysis of each app. They are ranked in descending order, so that #5 is the site that had the most room for improvement and #1 is the site that did the best job at visualizing and presenting a standalone fitness activity. Clicking on any of the following map images will take you to the full interactive versions.
Workout map analysis
5. Ironically, the least impressive visualizations come from the suite of Map My Fitness sites. They’ve taken a different approach to structuring exercise data, storing the map separately from the activity. This provides “routes” that can be run/biked/exercised over and over, but it also means there is a strong disconnect between the exercise data and the location data. As a result, there are no charts of speed, power, or pace. They do have a good interface for showing elevation data alongside the map. Hovering over the elevation profile moves a pin on the map at the given location: a nice feature to see where the hills happen on a 2D map.  4. The next step up for visualizations is Trimble Outdoors. It shows the map next to speed and elevation profiles for the activity. The profiles have hover interaction showing the exact value under the cursor. They also allow the x axis to be swapped between distance and time. This is a huge step up from the Map My Fitness approach. In addition to having speed data for the whole activity instead of just an average, you can now see speed compared to elevation, letting you know how much hills come into play during your workout. One downside to the interface is the line charts are placed next to the map. This greatly reduces the possible resolution of a chart that really should be long and skinny to provide the best detail possible.
  3. Runkeeper is probably the next in line (although it is my personal top choice because of its other features). The elevation and speed charts are placed below the map, just like in the Map My Ride interface, only with the addition of the activity data, there is also a chart of speed. Unfortunately, the charts lack a vertical scale! This is important labeling, and it is very unfortunate that it has been left off. There is also no option to switch the x axis between speed and distance. One of the interesting things about the RunKeeper chart is the addition of a “pace” variable. Pace measures time over distance, rather than distance over time. (It is also the primary measure used in running.) Since this data is the inverse of speed, showing both of the variables at once doesn’t make much sense, so pace is turned off by default.
  2. Strava is where the visualizations really start to get good. The default view just shows elevation data, but clicking on the performance tab at the bottom shows a glorious huge map-linked chart of elevation, power, and speed. The charts are very well labeled and given plenty of screen real estate. Swapping between speed and distance on the x axis is provided. The power variable is calculated from the gps data and the weight of the athlete. This is a really nice addition, and it is surprising that the other sites do not have it. To complete the attention to detail, Strava is the only site that defaults the map to the terrain view. This is a no-brainer once you think about it: on an exercise, you don’t care about road information, what you care about is terrain type. All around, a very good showing from Strava!
  1. As good as Strava is, Garmin Connect has done just as well. The default view is missing some key features like linking hover events on the charts to the map. Unfortunately, Garmin uses Bing maps which have rather ugly color choices, and while the terrain is visible, the predominant information on the map is the roads. That said, there is a killer feature hidden in the map pin. Clicking the map pin brings up a full page dashboard with animation! The play button steps through the workout, moving the map pin along the way. The animation is a novel feature, although it doesn’t add a whole lot of usefulness. There are some really useful features in this view, though. Bars at the bottom of the dashboard show total distance, total time, current elevation, and current speed for the selected timestep. The line charts are interpolated beautifully, and while this may not be the most accurate, it makes the charts easier to see and read. Full width charts are also fantastic, they allow a great view of the data.
Can they be better?
Now that we’ve seen what fitness visualization options are out there, how can we improve them? Each service has places to improve to match the competition, but what about features that none of them have? A focus+context approach to the line charts would be fantastic. As a cyclist, sometimes rides get very long, and that crams a lot of data into a tiny space. Providing a zoomed view and a contextual view can remedy this. Garmin’s bars are a very nice addition; it would be nice to see the power variable from Strava in the same visualization. Showing calories burned so far, or calories burned per minute would also be a great chart addition. The ability to ghost two activities together into a single visualization for comparing would also be nice. As a disclaimer, many of these sites support more detailed collection devices. The data for the case study ride was collected only with an Android phone with GPS. A fully outfitted athlete can track things like cadence, heart rate, steps, efficiency, and more. These extra data dimensions can add richness to the data and visualizations.
Aggregation
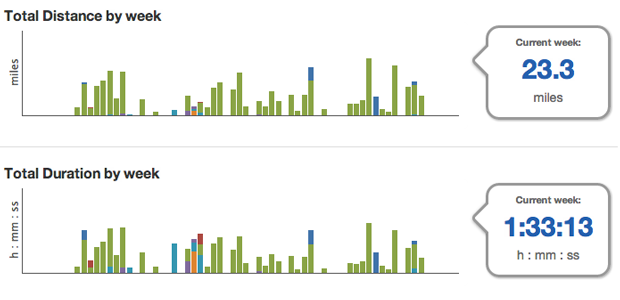
In addition to the individual activities, the aggregate sum of activities can also be visualized. Runkeeper is by far the best at this (one of the reasons it is my top choice). Overall reports can be generated for each individual activity type, or all activity types together.  A paid account gets you access to even more detailed aggregate reports.
  The other services don’t have views that even approach this. The closest is the calendar view that MapMyFitness and Garmin both have.
  These aggregate views are the best place to gain insights into your overall fitness. You can’t make much improvement during an individual workout, but over the course of weeks and months, patterns in fitness can become visible. These long-term patterns can motivate you to continue exercising and provide insights into how you can maximize improvement. Drew Skau is a cycling PhD Computer Science Visualization student at UNCC, with an undergraduate degree in Architecture.