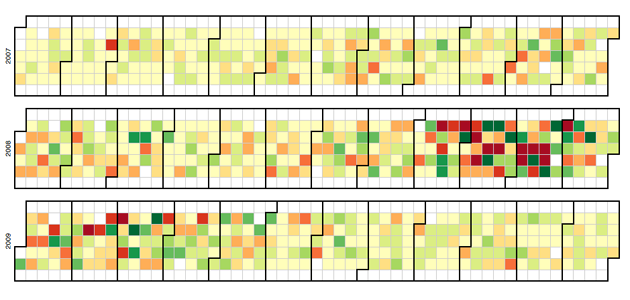
When D3 came out in 2011, it became clear pretty quickly that it was going to be a powerful tool for creating data visualizations. But it’s certainly not the first — or only — tool. Why did it succeed when so many other libraries have failed?
Download this post by entering your email below
First of all, it works on the web. Data visualizations are only good if people see them, and there’s no better place to see them than on the internet, in your browser. Protovis was the first library to make any real headway in this direction, despite other libraries and services that tried.
First of all, it works on the web. Data visualizations are only good if people see them, and there’s no better place to see them than on the internet, in your browser. Protovis was the first library to make any real headway in this direction, despite other libraries and services that tried. Manyeyes is cool, but it lacks graphic flexibility and the resulting visualizations can’t just live anywhere seamlessly. Prefuse and Flare (both predecessors to D3) are nice, but neither one runs in a browser without a plugin. Quadrigram (previously Impure) has the same plugin problem.
Another reason it has worked so well is because of its flexibility. Since it works seamlessly with existing web technologies, and can manipulate any part of the document object model, it is as flexible as the client side web technology stack (HTML, CSS, SVG). This gives it huge advantages over other tools because it can look like anything you want, and it isn’t limited to small regions of a webpage like Processing.js, Paper.js, Raphael.js, or other canvas or SVG-only based libraries. It also takes advantage of built in functionality that the browser has, simplifying the developer’s job, especially for mouse interaction.
All of these features have been timed perfectly to coincide with the rise of new browsers and a push towards documents created using open standards rather than relatively walled-in plugins. The death of Internet Explorer as the top browser plays no small role in this, and the rendering and javascript engines in other browsers have made huge strides with their newfound attention. Some of this momentum has carried over to D3 as a way to take advantage of the new features and technology buzz.
But snazzy new technologies that work seamlessly aren’t the only reason that D3 has become successful. Great documentation, examples, community, and the accessibility of Mike Bostock have all played major roles in its rise to prominence. Without these components, D3 would likely have taken much longer to catch on.
So how about D3’s disadvantages? DOM manipulation can be extremely slow for large numbers of entries. SVG also has performance limitations when dealing with large quantities of elements. Fortunately for D3, good data visualization rarely requires drawing these quantities of elements on the screen. There is a learning curve to javascript, but this is true of all tools, and with great community support, learning is much easier.
Perhaps the most important part of D3’s success is the position and approach it takes. It is not a graphics library, nor is it a data processing library. It doesn’t have pre-built charts that limit creativity. Instead, it has tools that make the connection between data and graphics easy. It sits right between the two, the perfect place for a library meant for data visualization.
Looking to create more data-driven content? Check out our whitepaper, Data Driven Content Marketing.
Or, take a look at what else we’re doing with data:
- The World’s 50 Most Influential CMOs of 2015
- The 2016 CES Influence Report
- The 2016 Grammy Awards Influence Report
Drew Skau is Visualization Architect at Visual.ly and a PhD Computer Science Visualization student at UNCC with an undergraduate degree in Architecture. You can follow him on twitter @SeeingStructure


