
Learn what is an interactive data visualization and its benefits for your business
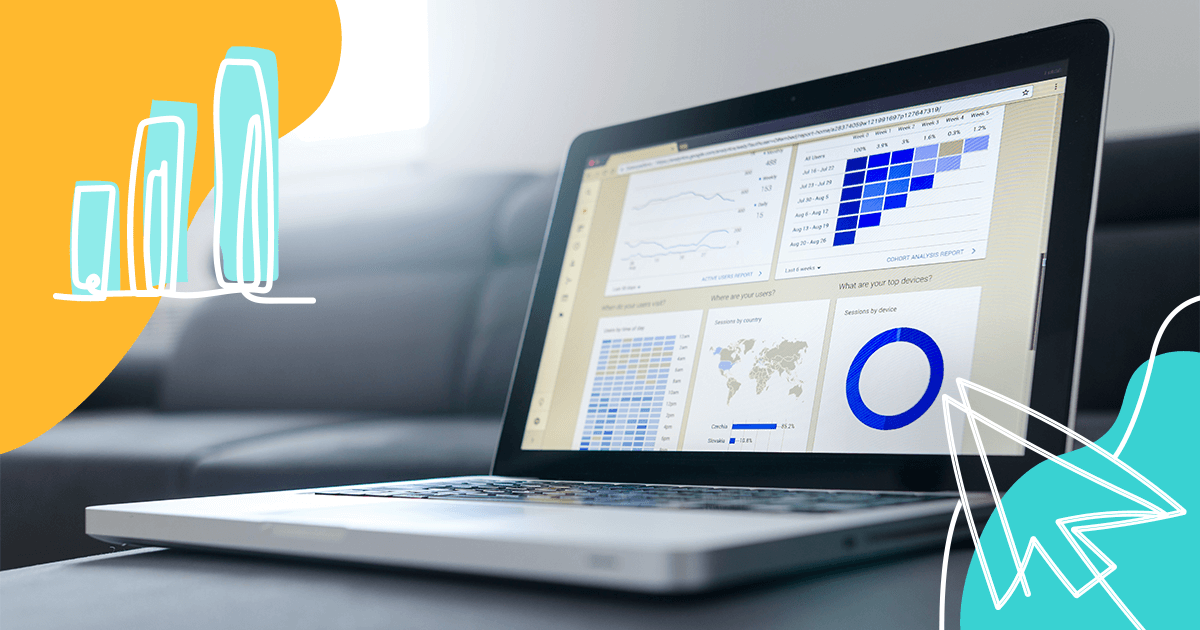
With interactive data visualization (using 2D or 3D content), we can quickly and effectively comprehend the meaning of d(...)
With interactive data visualization (using 2D or 3D content), we can quickly and effectively comprehend the meaning of d(...)

Data visualization has been around for ages, from times when humans used drawings in caves as a form of communicati(...)

Knowing the different types of data visualization is crucial for you to structure your reports and presentations. Each f(...)
Big Data visualization techniques — charts, maps, interactive content, infographics, motion graphics, scatter plots, r(...)

Motion graphics cost is not always as high as marketers think. It is possible to achieve good results at an affordable p(...)

About 15% of the global population experiences some kind of disability. Bearing that in mind, many companies already inv(...)

There may be billions of people in the world but we are not all that different. We are very similar in some ways, which (...)

Marketing has been a rapidly developing area, leaving behind those who do not have the resources or skills to keep up wi(...)

When it comes to webpage design, a Z-shaped pattern for reading plays an integral part in a website’s performance (...)