
Making Words Work: Balancing Text and Graphics for Greatest Impact
While a picture may be worth a thousand words, words in a picture are worth even more. Using text to tell a story as it&(...)
While a picture may be worth a thousand words, words in a picture are worth even more. Using text to tell a story as it&(...)

October is a month for spooks. Trees lose their leaves and look creepy. Pumpkins ripen and are carved into glowing-grin (...)

Bar and column charts are one of the most frequently used chart types. They are simple to understand, simple to make, an(...)

There has always been a connection between architecture and visualization. Not all visualization is about communicating (...)
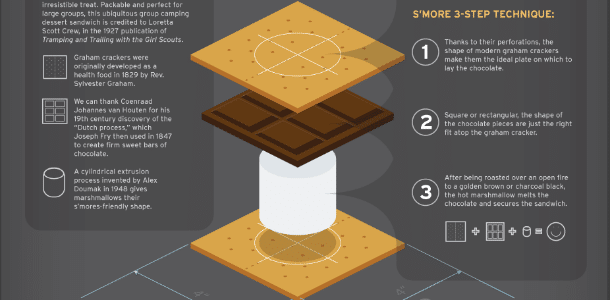
As Summer approaches, camping trips are picking up. They are a great way to get away from it all and forget about the hu(...)

Here’s a list of 20 coffee infographics to start your day: Coffee is a daily habit for more than half of American (...)
What data visualization best practices your company can rely on to deliver information? Find out the best graphs and cha(...)

Network visualization is a great strategy to with data. This content formed by links and nodes is pretty interesting and(...)