Infographics often contain time-sensitive information. Current events need to be covered within a certain timeframe after they happen in order to keep relevance, and promotional infographics need to be created and published with enough time to get the word out. A successful infographic launch takes a lot of planning and coordination and starting the project soon enough is critical to producing a good result. Many people get this right. The 23 June 2013 Supermoon did a great job of completing their graphic and publishing it with enough time to get some good pickup before the event. Obviously, there is no way to delay the Perigee stage of the Moon’s orbit should the graphic be delayed by a few days, so the right timing was critical.

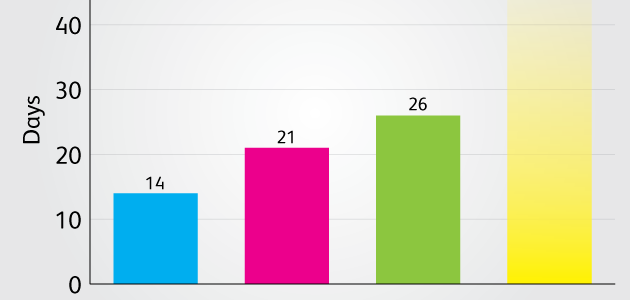
So how far in advance should you be planning on creating your infographic? As a rule of thumb, the whole creation process should take about a month. This includes coming up with the idea, getting the financial support, finding the team to create the graphic, going through several drafts of the script and the design, and final edits. The Visually Marketplace offers several project tiers, each taking a different amount of time to complete. Tier 1 projects involve a designer building an infographic from a script the client creates. Tier 2 projects involve a journalist researching and writing the script, and the designer building the infographic from that script. Tier 3 incorporates a creative director into the process to oversee everything and help guide the process. Custom projects are usually some mix of the three.  But sometimes projects go over their deadline. So, why the delay? Designers, journalists and clients have deadlines set for each part of the process. Designers and journalists hit their deadlines consistently. In 99% of delayed projects, the delays are due to the client. Visually does offer rush services for a fee, and this can cut those times down significantly depending on the complexity of the project. But, if you can save money by thinking ahead and being prepared, why wouldn’t you? So, what can you – the client – do to speed up the process and get your graphic out faster? It all comes down to several important factors, which we discuss below:
The importance of timely feedback and proper planning
To keep a project on schedule, it is important that you provide your feedback within the specified deadlines in the project timeline. You can make that happen easily by planning ahead of time. At the start of your project, take a look at the timeline and note when each deliverable will be coming in — then plan your meetings in advance, so that everyone whose feedback is needed can provide it within your timeline. Often, the deliverables are submitted early. When this happens, go ahead and send the file to everyone in your organization ahead of time — this will give you even more time to collect and organize everyone’s feedback to relay to the creative team.
The danger of having too many cooks in the kitchen
Many clients include too many people in the feedback process. Set up a point team of no more than three people to approve the scripts and design. Design by committee is a notoriously bad way to do anything creative.
Don’t disappear
Regardless of whether you are creating your infographic on the Visually Marketplace or not, stay on top of your project and be involved with your designer. If your planned vacation falls right in the middle of the infographic production timeline, appoint a member of your team to take over the process while you’re away — or let Visually know about your schedule in advance, so a project manager can adjust the timeline and everyone’s expectations.
Communication is key
We cannot stress this enough. Prompt and frequent communication is the key to getting projects done quickly. The record completion time on the Visually Marketplace is one day! Always looking ahead and being prepared for the next step can drastically shorten your creation time. Drew Skau is Visualization Architect at Visual.ly and a PhD Computer Science Visualization student at UNCC with an undergraduate degree in Architecture. You can follow him on twitter @SeeingStructure