
Is your SEO strategy generating real results in your Digital Marketing plan? Can you prove these results to your clients or your boss?
One of the biggest challenges for SEO professionals worldwide is not only to create content that rank or generate an increase in traffic, but to be able to present the impacts of your strategy with good reports.
And of course, a good report can not only present the current situation and the obtained results, but should provide insights to define the next steps.
Here you will see how to make good SEO reports, understand what the main metrics we need to present are, how to do performance analysis and how to set priorities for the following months.
What is an SEO report?
An SEO report is a document where you organize the performance and the current moment in which your strategy finds itself, highlighting the positives, points of attention and the following steps for the strategy to obtain real results.
The big problem for many companies is to make superficial SEO reports, which do not generate insights and often point to indicators that are not relevant to the business
The main objective of a report is to understand the most relevant metrics and monitor their performance.
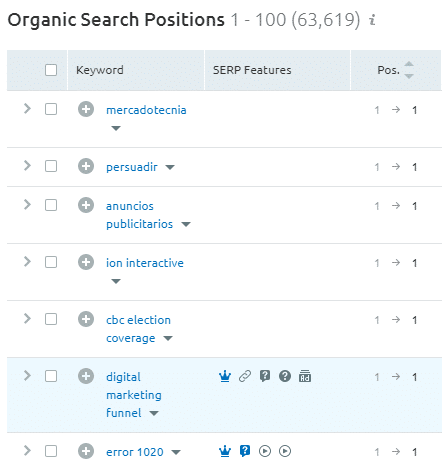
Let’s look at an example. Would you say that the SEO strategy below is successful?
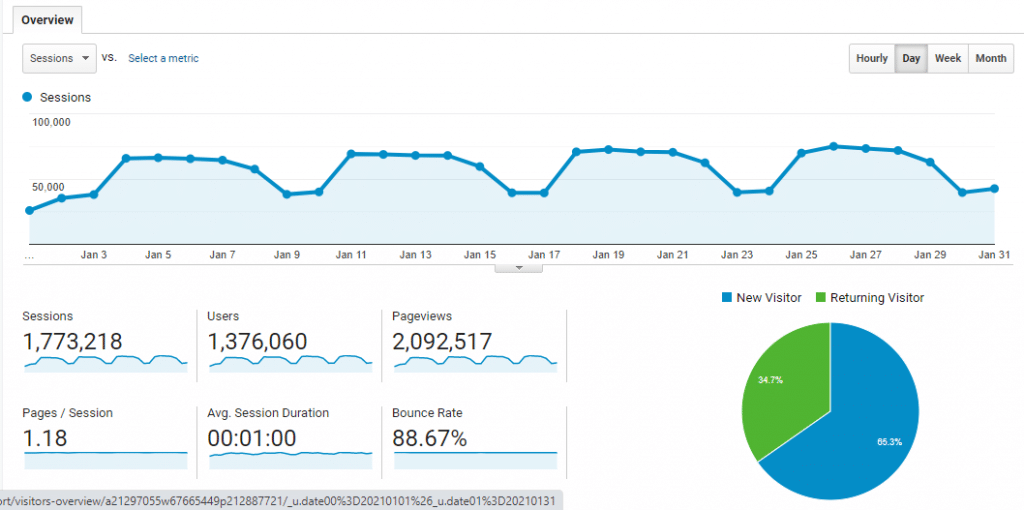
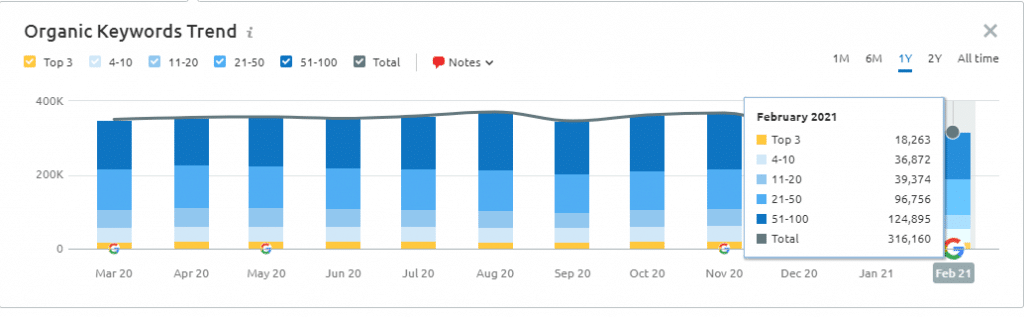
Let’s see: a considerable traffic of more than 1,7 million hits in just one month and more than 18 thousand words indexed among the top 3 positions!
This is definitely a successful strategy, right?
It depends.
Let’s assume that we analyzed this strategy further and found the following numbers:
- Leads generated via organic traffic: 0
- Customers acquired via organic traffic: 0
The hard truth for many SEOs (myself included) is that traffic and the number of indexed keywords are… vanity metrics!
In order to identify which metrics are most relevant to an SEO strategy, it is necessary to have a very well-defined little thing. Learn more about it below.

First of all: Understand your Goals with your SEO Strategy
No, the focus of any SEO strategy is not to rank for as many keywords as possible and generate a truckload of traffic.
As we saw in the example, a company can generate one million sessions a day and still not sell anything to that traffic.
Suppose I create a great strategy for ranking for the following keyword with Rock Content’s blog:
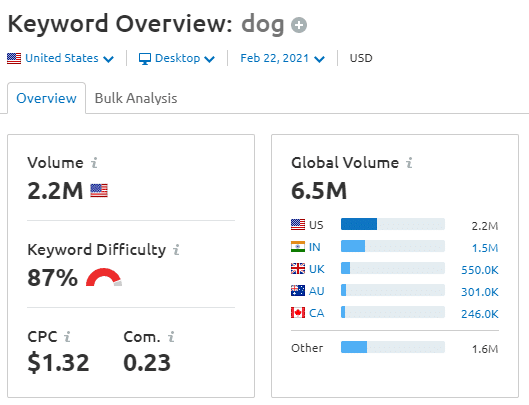
Wow! 2,2 million searches per month!
But would it make sense for our strategy? Searching for “dog” on Google, after downloading a Marketing ebook and finally hiring a content strategy is the natural path that no one in human history will ever follow.
I know this is a very radical example, but often our strategies are based on words like that. And that is why, in order to define our metrics, we have to have very well-defined goals.
Let’s look at some examples.
Do you want to increase sales?
What are good metrics for that goal?
- Organic leads
- Branded Keywords (words directly related to the brand, for example, “Rock Content”)
- Organic sales
Your strategy may not need a bunch of traffic to achieve these goals.
Do you want to boost your brand awareness?
What if your goal was to improve the perception of your brand in the market?
- Number of indexed keywords (focused on the persona)
- Organic traffic (of quality)
- Branded keywords

Do you want to educate the market?
If the goals were to educate the market, which metrics would be good indicators?
- Keywords (related to the market)
- Organic traffic
- Content performance (Time on Page/Pages per Visit/Bounce Rate)
The first step for you is to be able to analyze your current situation with quality. Then, to understand exactly where you want to go with your strategy.
If you don’t know where you want to go, you’ll never know when you got there.

5 SEO Reports You Should Be Doing
Now that we have clarified this starting point, we can begin our practical part. Let’s see how to make a good report.
To teach you how to do the analysis, we will focus on the points that are the main pillars of an SEO strategy.
The priorities, as we said, will vary according to your goals.
We will then see how to make an in-depth analysis that generates conclusions and tasks from the main points. They are:
- Traffic
- Content Performance
- Keyword analysis
- Blog Health
- Backlinks Profile
So let’s go ahead!
Important note: the purpose of the content is not to explain how you will organize your analysis. It doesn’t really matter if you’re going to use spreadsheets, slides or even Notepad.
The important thing is that you read this content and leave here knowing exactly what to analyze, how to analyze it and that your SEO reports really take your strategy to the next level.
1. Traffic
If traffic as a raw number can be a vanity metric, doing a thorough analysis of your traffic is far from an unimportant step.
Understanding your traffic is one of the most important factors for your strategy’s success. The problem is that our traffic analyzes are often extremely superficial.
We usually do the following:
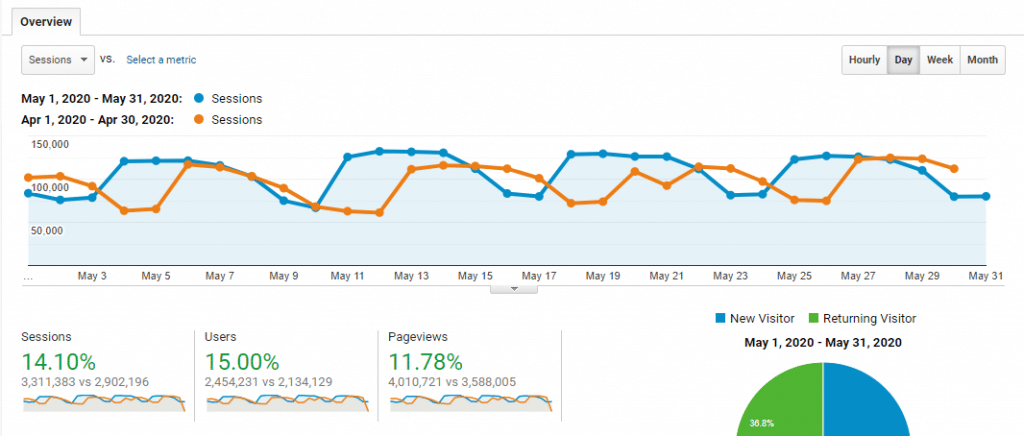
I compare the organic traffic of my month in May with the previous month.
Wow! What an incredible number. We increased our traffic by 14%. Almost 430 thousand visits more than the previous month.
Therefore, we deduce that our SEO strategy is a success.
However, this analysis of the numbers is absolutely poor and superficial. Despite this growth, if we analyze the month of May more deeply, especially if we compare it with the numbers of May of the previous year, we will see that the growth was not the desired one.
An interesting analysis is that you understand what your annual growth is and the percentage of annual traffic that each month usually brings to your blog. This will give you a better perspective of your monthly performance.
Take, for example, a comparison from January to October in 2018 and 2017:
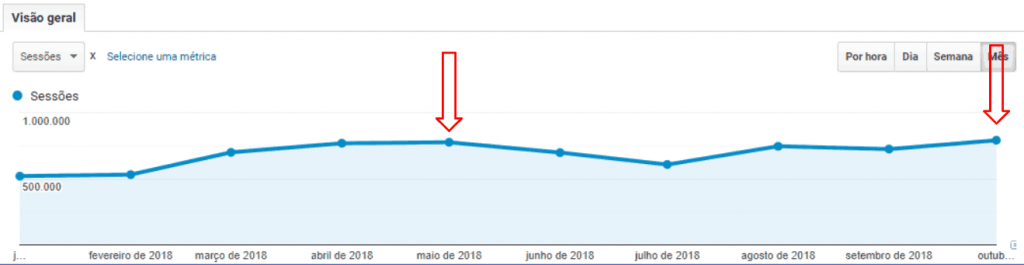
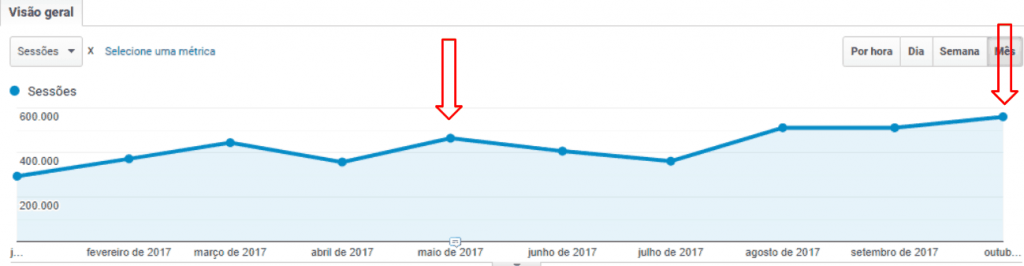
It is interesting to see how the years follow a growth pattern. January is usually a month with lower traffic, as well as July and December — which are seasonally weaker months.
Note, however, that in 2017, May was the best month of the first semester, and October was much higher than that.
In 2018, our month of October grew much less compared to May, which shows that this year we were unable to maintain the growth we had in previous years.
The blog grew little in the second half of 2018. This shows that our analyzes cannot be limited to the month vs. month and percentage of growth between them.
Important points to analyze
As we’ve seen, traffic alone doesn’t mean much. Neither do the green numbers in Analytics from one month to the next.
It is essential to know what are the most important metrics and results to monitor according to our goals.
As an example, I will point out three interesting indicators that I like to follow here at Rock and that you can apply as well. Of course, you can add other metrics and analyzes focused on your specific situation.
I. Expected growth
As in the previous example, an important indicator that we follow here is the expected growth for the year.
In line with the growth of previous years, we make a projection and consider the traffic that each month usually represents annually.
From that, we have a growth projection.
That way, we can see that the growth in the second half was not satisfactory, not because there was no increase month by month, but because the growth was low based on the performance potential of those months.
As I have used this example before, I am not going to spend too much time talking about expected traffic. Let’s go to the next KPI.
II. Traffic quality
As we said, traffic alone is a vanity metric.
It’s no use having a liquor store and the traffic on my site is mostly children and teenagers.
Therefore, there are some data and metrics that will help to indicate whether the traffic you receive is exactly composed of the visitors you want.
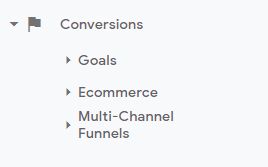
Conversions
The first and most important factor is conversions. They are the primary indicator of whether visitors to your blog are really the persona you want to attract.
For this, it is essential that you have conversion points on the website and on your blog, leading your visitor through the sales funnel.
After all, your ultimate goal is to convert them into a customer and/or promoter.
This analysis helps to understand visitors and the failures at each stage of the funnel. You often generate a lot of conversion at the top of the funnel, but that still doesn’t guarantee that it’s the visitors you want if they don’t follow the buyer’s journey.
You can track these conversions through automation tools like Hubspot, Mautic, Mailchimp and RD Station.
Or you can create goals and conversions within Google Analytics to track the quality of your traffic and the results generated by your visits.
It is important to always remember to segment the traffic in “Organic Traffic”, after all, we want to do an analysis of the traffic that comes from Google.
Pages per session, average session duration and bounce rate
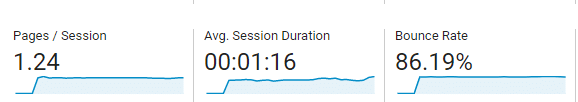
These are three other very important traffic indicators that help to identify the quality of visitors and their content.
If the audience you are attracting consumes more and more pages from your site, stays on your content for a long time with each visit and usually interacts with your blog, it is a sign that you are attracting the right people.
Although it is not as efficient an analysis as a conversion analysis, it helps to demonstrate that this can often indicate a failure of our conversion points, rather than the quality of your traffic.
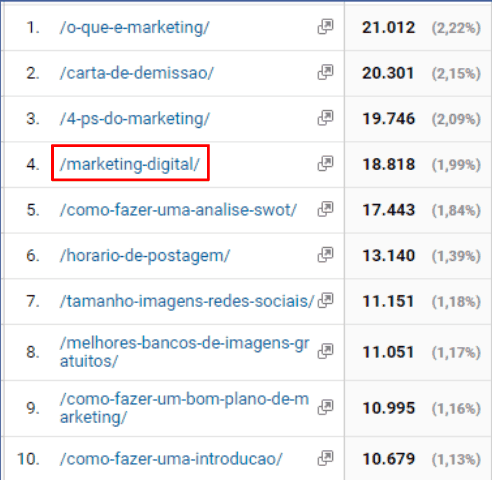
Most visited pages
The most visited pages are an important factor for you to understand the value of your pages and the performance of your blog as a whole.
For example, some of our content here at Rock has enormous value for us because it brings a high volume of traffic. Especially when that traffic has great potential to go through our sales funnel.
A good example is our Digital Marketing post in Brazil:

That content alone generated more than 25,000 visits on our blog. And it is a gateway for many clients here at Rock.
Then, tracking the performance of your pages is essential to understand your traffic as a whole and, especially, to track traffic drops and growth.
The standard analysis when we want to verify the pages of our website/blog is to select the month (or quarter or week) and compare it with the previous month.
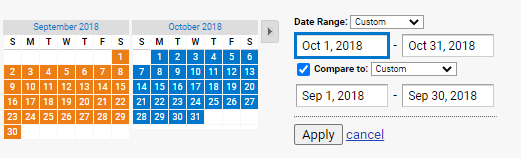
This is a necessary analysis and should really be done constantly. However, it can hide some precious information.
A good tip is to reverse this search:
This is because the selected month is what Analytics will use as the basis for the comparison, that is, it will show the pages with the most access for the initially chosen month.
See the difference of analysis when the starting point was October (in Portuguese):
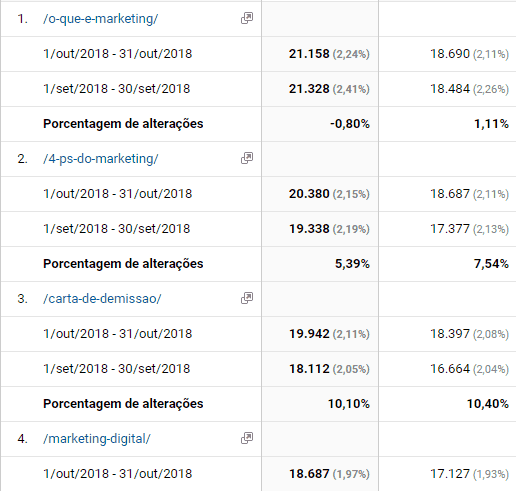
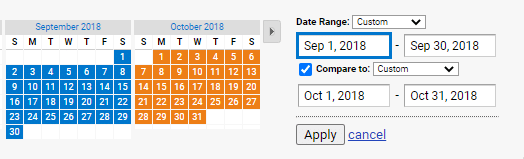
And when the starting point was August (I changed September to August because the results had a more significant change for this example):
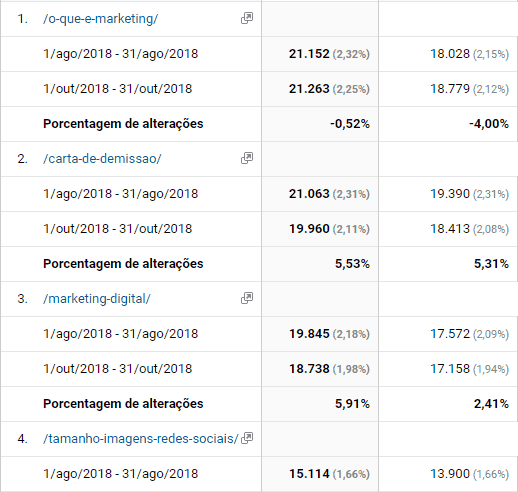
When you use the previous month as a starting point, it will be easier to identify pages that performed very well and are not performing now.
A good example of this was when we had an indexing problem with our Content Marketing page.
Despite being one of the most important content on the blog (after all, it is our core business) it is not the content that receives a huge amount of traffic. As such, it is not usually among our top 10 most visited content.
When I made this inversion between months, I realized that the post Content Marketing was in the top 20 in the first weeks of December. However, in the final weeks, it had zero access.
Perhaps without this inversion, I would not have noticed, since we were still in first place on Google (but with another page), and normally it is not among the most accessed, calling attention to the drop in traffic.
This little story just demonstrates the importance of this investment and to keep looking for more information with the data we have.
Identifying reasons for declines or growth
More important than finding declines or growth, is to understand why a page lost or gained traffic.
Here are some analysis suggestions that can, and often are, the reasons for traffic variations:
- Gain/loss of positions in the SERPs.
- Gain/loss of SERP features, like Featured Snippets, People Also Ask, Carousel.
- Organic page CTR has dropped (refers to the percentage of clicks that SERP’s organic results receive. Often, Google places a knowledge graph or panel, and this increases the number of ads on the page, affecting the number of clicks on organic results). One tool that helps you see the CTR of a specific results page is Moz’s Keyword Explorer.
- Keyword seasonality, as some keywords have a huge traffic variation at certain times of the year, for example: turkey, Easter eggs and World Cup.
- CTR (Content Performance), the number of clicks on a specific page fell in the SERPs.
Traffic Summary
Current situation:
- Growth consistent or not with the expected for that period
- Traffic on the most important content
- Conversion performance and traffic quality
Opportunities (Next Steps):
- Identify opportunities from declines and gains
- Content that lost positions
- SERP features available
- Seasonality, location, etc
- A good traffic analysis is essential to help in the analysis of content and keywords
2. Content analysis
A good SEO analysis needs to go through the contents of your blog.
First of all, you need to identify which posts are the most important for your website/company.
The most common thought is that the pages that generate the most traffic are the most important for a website. And this is not necessarily a reality. As we said, traffic can often be a metric of vanity.
As an example, check out the pages I really consider the most important at Rock (in Portuguese):
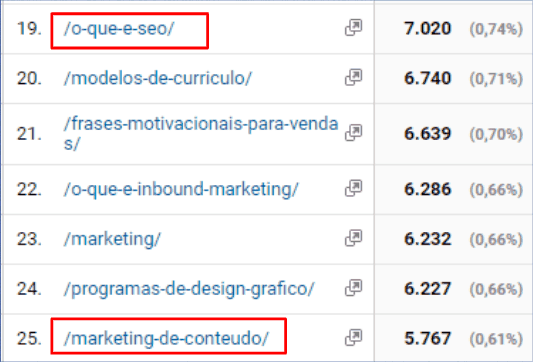
There are several pages that generate much more traffic than the ones highlighted, but when we think about our market and the services that Rock offers, these are the pages that educate and lead our potential customers through our funnel.
Therefore, the main pages are not the ones that generate the most visits, but those that have the greatest business potential. Or a balance between the two, like the ones above.
When identifying these main pages, we need to audit these pieces of content. What is quality content? How do I evaluate to see if my content really deserves to be on top of Google?
We’ll look at some key indicators to identify that quality, factors that tell Google whether or not content has quality.
I. User intent
The first assessment that your content needs to receive is: does it really answer the user’s search intent?
For this, it is essential to analyze the results that Google considers most relevant and the topics they address.
The following metrics are also indicators that this intention is being answered or not.
II. Time spent on page
The sign that this metric indicates is somewhat obvious, after all, the longer visitors stay on the page, the higher the quality indicator of the page.
After all, if the content was uninteresting, hardly anyone would read it until the end.
An important relationship when analyzing this metric is to make a relationship between time and content size. And also compare it to other pages of a similar size.
A page with a piece of content of 500 words that has 1 minute of stay can be considered a good page. However, if it had 10,000 words and the same time, it would probably be a worrying indicator.
Evaluating this metric alone, however, is not enough. Like the next ones, these Google Analytics metrics are related to each other and should be evaluated together.
III. Bounce rate
The bounce rate represents the percentage of people who visited your page and left without any interaction with it.
It is an extremely relevant sign, after all, if people interact with your content (comment, click on a link or CTA, fill out a form) it is a sign that they are enjoying what they are seeing.
In addition, if a visitor accesses your content and returns to the results page, it is a strong indicator that your content does not answer the intention of a specific search.
IV. Pages per visit
Another important metric that can be tracked by Google Analytics and that is directly related to the bounce rate, is the number of pages that the user accesses on each visit to your site.
If every visitor arrives and leaves the same content, it can send a negative signal, showing that your content is not engaging enough and that your CTAs are not convincing at all.
This is directly linked to the quality of content.
Therefore, the higher the number of pages accessed by the user, the better the quality signal that content transmits.
V. CTR
The title is undoubtedly one of the main elements of a piece of content. When done well, it attracts clicks and several visitors to your site.
However, a bad title is enough for an extremely high-quality content to never be clicked.
That is why the click-through rate (CTR) is one of the most important metrics to be followed. It demonstrates the quality of content and, in particular, of its titles.
You can track the CTR of your pages through Google Search Console, in the following tab:
You can select a specific page and then view your CTR for your searches.
From there you can find out which titles and meta descriptions need to be optimized and track and compare performances.
VI. User behavior
The user experience within the content is not a specific metric, but it is certainly a source of great insights.
Understanding what has attracted more clicks, at which part of the text people tend to stop reading, which parts attract more attention, etc., helps to understand not only the quality of the content as a whole but also of specific moments.
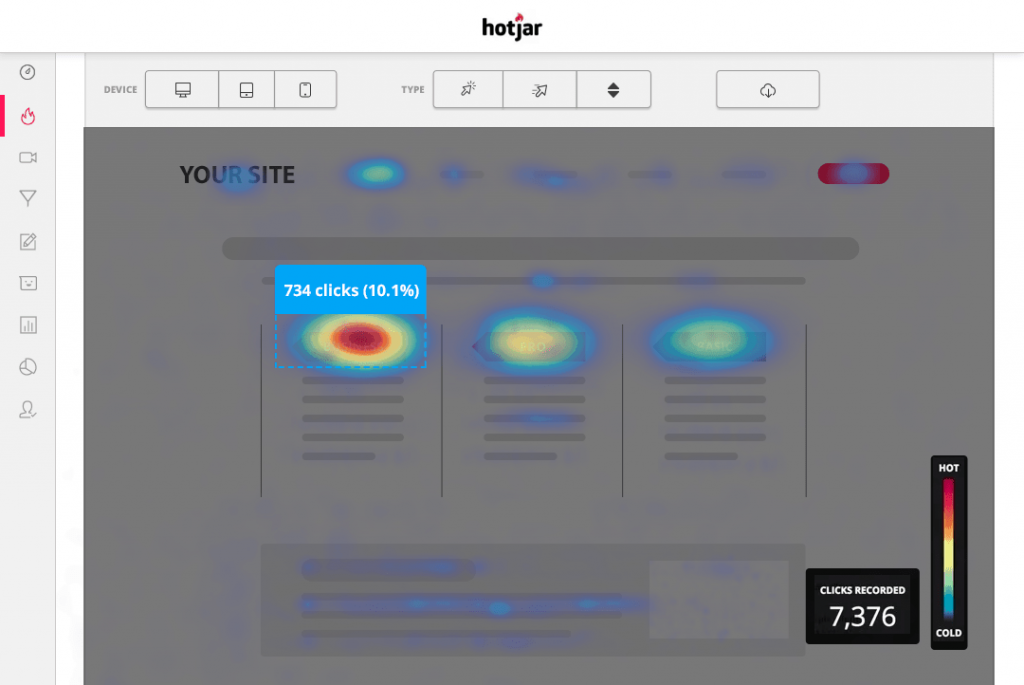
An excellent tool to monitor visitor behavior within your page is Hotjar, which makes heat maps, records visits on your website, shows where people usually leave the post, among other things.
A good SEO audit analyzes the quality of the content, after all, the secret of SEO is that you are the best answer that Google can present to a user.
These metrics and analyses are a way to make sure you’re reaching that level. Bad content = bad SEO.
Summary of Content Analysis
Current situation:
Check the performance of the contents:
- Conversions
- Length of stay
- Bounce Rate
- CTR
- User behavior
Opportunities (Next Steps):
- Identify opportunities for improvement
- Content update (time on page)
- Improve titles (CTR)
- Make good CTAs and internal links (Bounce Rate/Conversion/Pages per visit)
3. Keyword analysis
Another great pillar of SEO strategies are the terms that you want to be the answer to when someone performs that search.
A good SEO strategy goes through a good definition of those keywords, and a quality SEO report provides an analysis of those words.
Some useful tools to help at that time:
I. Daily monitoring
Any website/blog has its main keywords, as we have already exemplified that when we talked about the most important pages of a website.
In addition to tracking and analyzing traffic on these pages, it is essential to monitor your positions daily.
The faster you identify declines, the faster you can react and recover those positions, preventing an even greater drop in traffic.
In tools like SEMrush and Ahrefs you can select your main keywords and do this daily monitoring:
This example shows some of the most relevant terms for the Rock Content Community, seen through SEMrush’s “Keyword Tracking” tool.
II. Opportunities for topic clusters
In addition to tracking the keywords that we have already ranked, while doing a good SEO report it is important to find some opportunities that we are not yet taking advantage of.
This is when you will discover gaps and opportunities to generate more traffic.
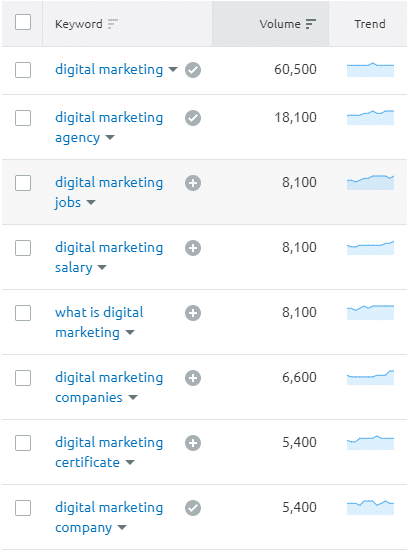
SEMrush has an excellent tool for finding long tail keywords, the Keyword Magic Tool. From a keyword like “Digital Marketing”, it presents several opportunities for satellite posts and words never used:
Another one that gives you really cool insights is Answer the Public:
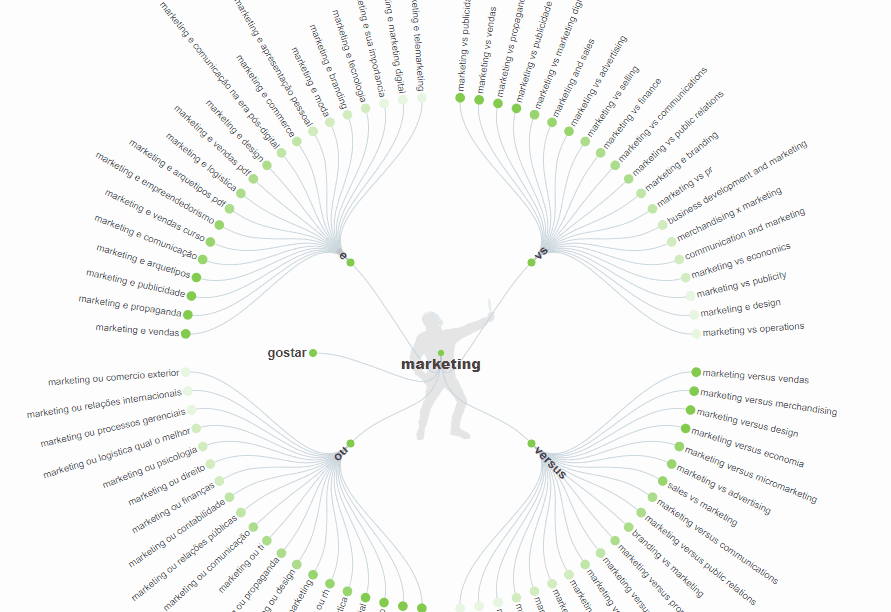
That works as a head tail followed by questions, prepositions, conjunctions etc.
III. Competition Analysis
You can find the best keyword opportunities by analyzing your competitors.
- You prevent them from having content that you don’t have.
- You discover new words for generating traffic on your blog.
You can use some of the suggested tools to analyze your competitor’s domain and see what the main keywords are for them, like this example using SEMrush:

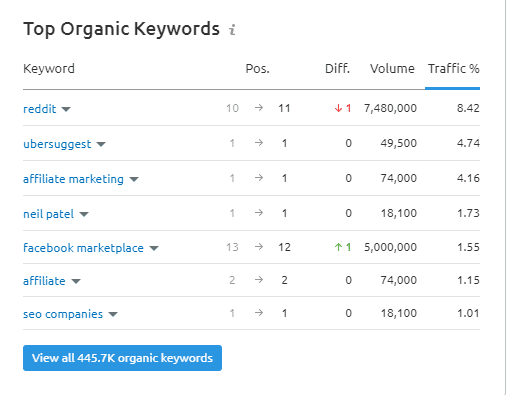
A feature that I really like about these tools is being able to segment which words you want to see:
- Words you and the competitor have in common.
- Words they have that you don’t.
The second option is very important, as it helps you find gaps and prevent competitors from having an advantage over you.
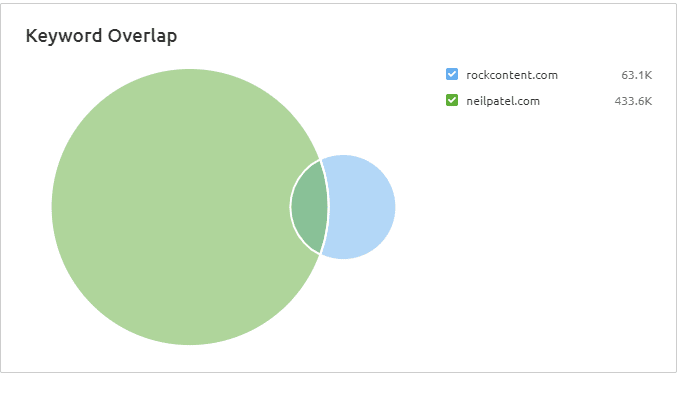
The circle in the image shows in SEMrush how to select the words I want between the two domains. The selected part would show me only the words that Neil Patel has and I don’t, for example.
IV. Opportunities for updates
You may be thinking that updating opportunities should be in content analysis.
And you are not wrong!
However, in our analysis of keywords, there is an excellent way to find content that can be updated and generate incredible results.
As an example, I will use SEMrush again, but other keyword tools may also have this functionality. The idea here is to identify the keywords you rank between the sixth and twentieth position:
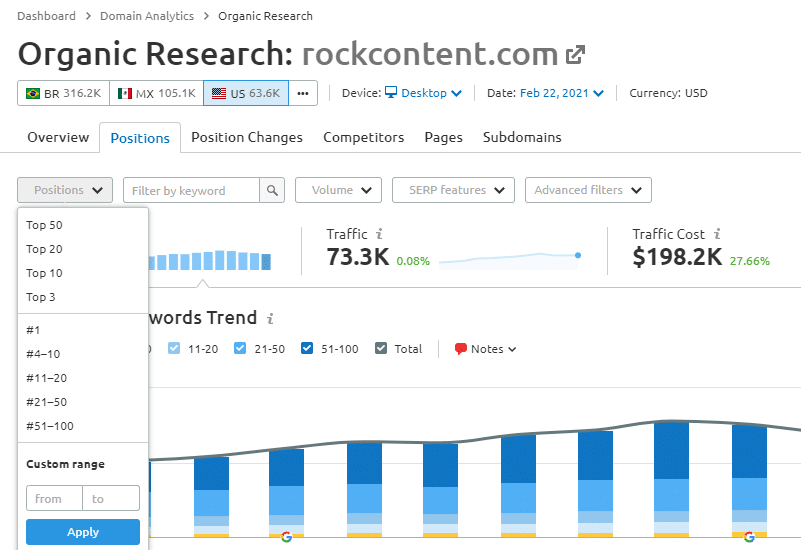
The positions that are between sixth and twentieth are the contents with the highest potential for rising in the SERPs, since they already rank relatively well and can improve a lot with an update.
Another way to identify opportunities for updating is daily monitoring. If you’ve lost positions or seen that your competitors have updated and improved theirs, it’s time to optimize too.
Updates are essential to attack and defend positions.
Keyword Summary
- Define the main keywords for the strategy (monitor their positions and create Topic Clusters to strengthen them).
- Identify attack opportunities (competition analysis).
- Find updates that can generate great results.
- Define when to attack and when to defend.

4. Blog Health
You can have excellent content, rank for many keywords, and have constant traffic, but all of that can be at risk due to the blog’s health.
Or health may be the reason you haven’t yet taken off at SERPs.
The website’s health audit is essential because it:
- Reveals errors on your site that you didn’t notice.
- Identifies broken links and pages.
- Helps to optimize the performance of your website.
By doing an audit, you will find a huge range of data and one of the most important steps is to understand what the priorities are:
- Identify the main errors and correct them.
- Optimize website speed.
- Avoid sudden losses of important rankings.
- A blog with bad health will not rank even with a good strategy.
I. How to do an audit
It is impossible to audit your site without good tools. Some of them are:
- Screaming Frog
- SEMrush
- Ahrefs
- GTMetrix (focused on page speed)
- Pagespeed Insights (ditto)
Among the 3 tools suggested for the complete audit, the only one that has a free version is Screaming Frog. However, of course, the version is limited and only crawls 500 URLs from your site.
Ahrefs also offers a free trial for 7 days.
These tools work by simulating Google’s crawlers crawling your website and, thus, present the possible errors that could harm your website in the eyes of the search engine.
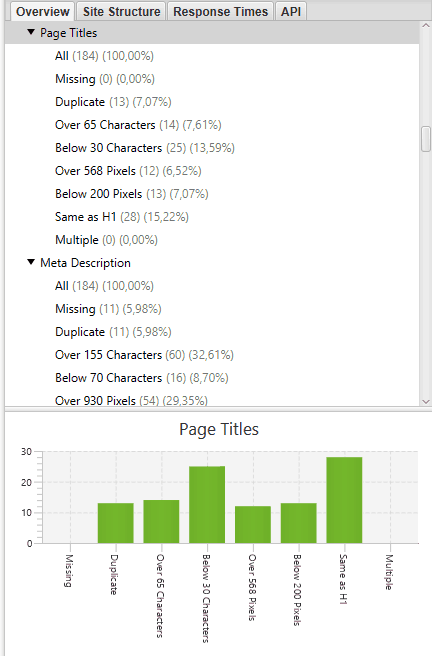
See this example on Screaming Frog:
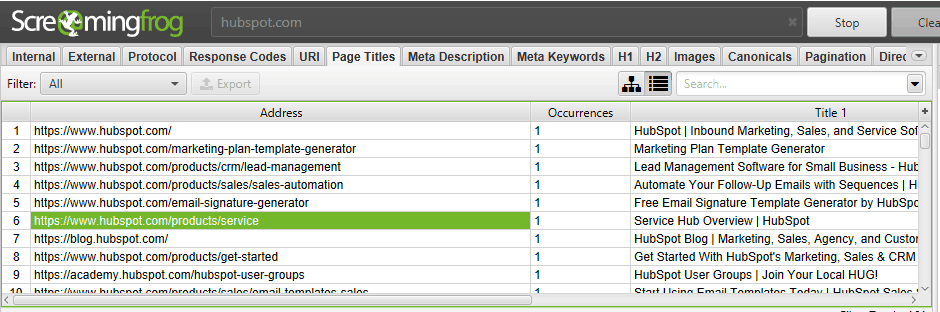
It analyzes the most diverse URLs on the site and presents what the bots read in each of them:
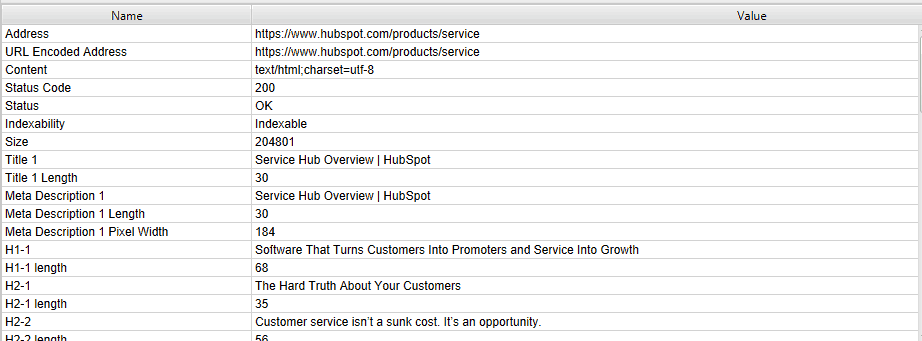
Thus, it points out errors and analysis in specific URLs and in the domain as a whole. In addition, it is possible to filter the errors and status you want to view.
Another excellent feature of tools like Ahrefs and SEMrush is that they present which of the errors identified in an audit you need to prioritize.
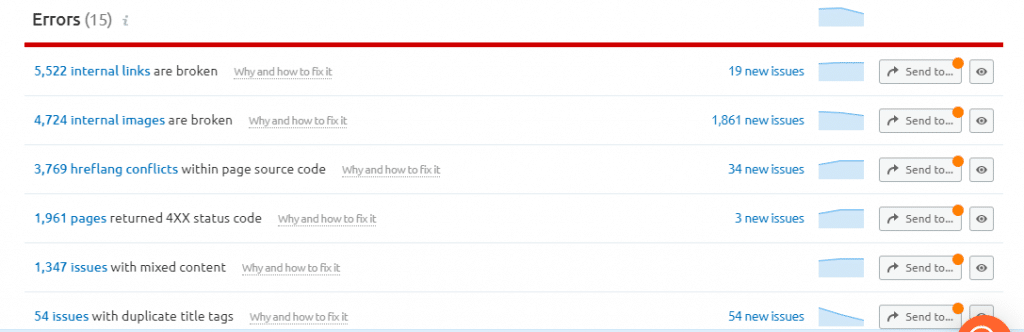
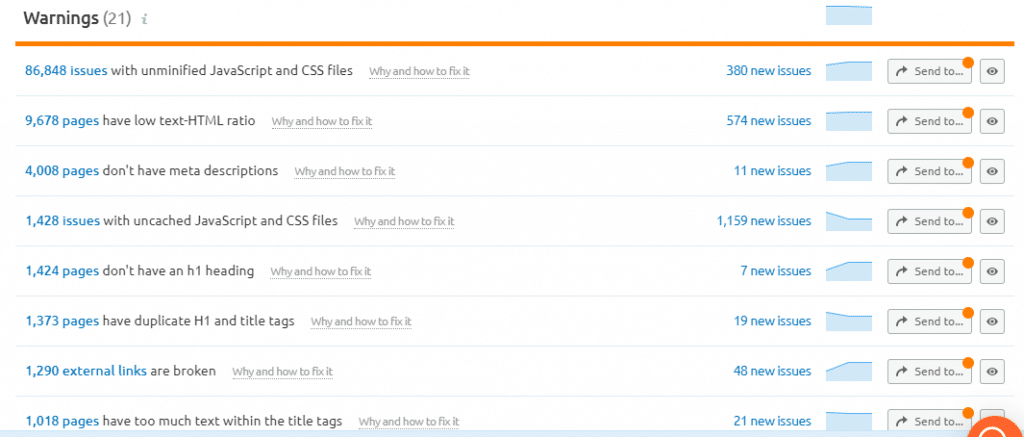
See this SEMrush audit example:
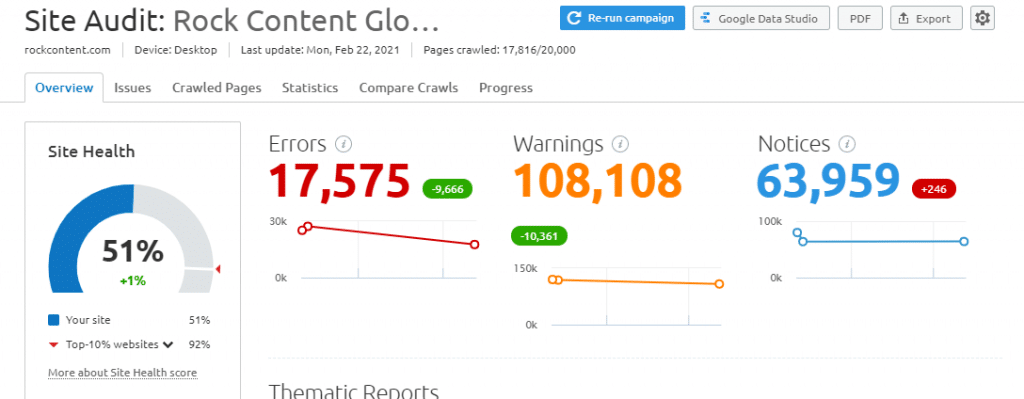
Note that the errors are divided according to their severity. And you can see the error lists and where they are located on the website.
In some situations you may be experiencing errors that you will not be able to correct:
In this case, it is best to focus on important errors that are hurting your blog/website and that you can easily resolve.
So, at this point in the audit it is important to:
- Prioritize the most important errors that can harm the site.
- Solve those mistakes that you can work on without depending on anyone else.
- It is not necessary to fix all errors overnight. Make strategic corrections.
- Not all errors need to be corrected.
You may be wondering why not all errors need to be corrected. The truth is that not all the errors pointed out are necessarily harmful.
Some are just good practices to avoid, for example:

Some pages on your site may have a low quantity of words, with less than 300 words, and still provide all the necessary information.
This is not very common, but it does happen.
In this case, the ideal would be to check the pages and, if necessary, update them.
II. Site speed
One of the main points in the health of a website is the load speed. I don’t know about you, but if a site takes more than 5 seconds to load my reaction is full anger.
That’s why Google attaches so much importance to this metric. However, it works a little differently than people often imagine.
The faster my website the better I will rank?
Not necessarily. The site loading very fast is not necessarily what will make you gain positions.
Speed is more related to punishment. It won’t boost your positions on the SERPs, but it will prevent you from losing rank. Speed is a prerequisite for being at the top.
Google itself already offers a very useful tool to optimize this metric, Pagespeed Insights:
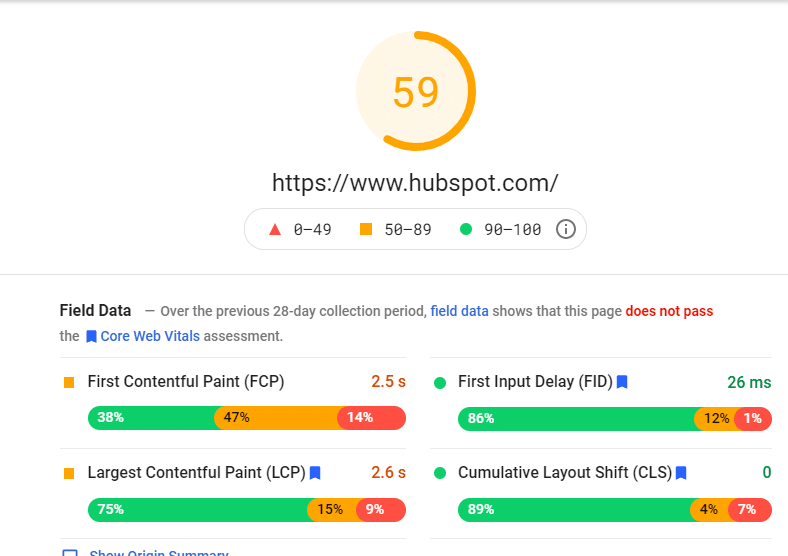
Pagespeed Insights evaluates your site’s code and pinpoints all the factors that are likely to be hindering the performance of your pages.
Ideally, you should not use your site’s home for this assessment, but rather the pages that are most important to your business and that need to rank for specific searches on Google.
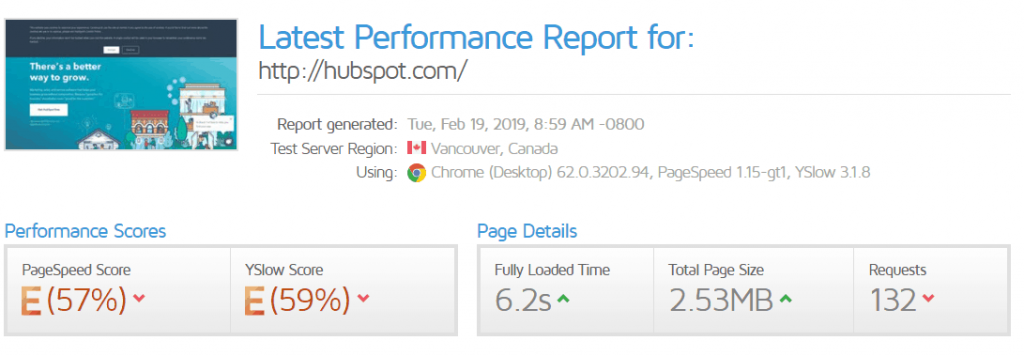
Pagespeed Insights does not show the exact loading speed of the site, so I suggest another tool—also excellent—that in addition to showing the improvements, presents the loading time:
Health Summary
Current moment
- Find the main mistakes on the blog and make an overall health assessment
Next steps (insights)
- Create an error correction goal (month/quarter)
- Set priorities
- Find opportunities
- Simple errors that generate great impact
- Ex: Plugin to compress images
5. Backlinks profile
It is no secret that the two main ranking factors on Google are: the quality of your content and your backlink profile.
Therefore, there is no good SEO report that does not track your profile. Some tools that can be used:
- SEMrush
- Ahrefs (better and more complete with regard to backlinks)
- Majestic
- Link Explorer
The first step in understanding the quality of your backlinks is to check their health. It will be a process similar to the site audit in the previous topic.
I. Backlinks health
The MozBar tool, which is an extension for the browser, can help you with a simple metric, but it is a good indicator:

The Spam Score shows the number of backlinks that give Google a bad image. Like harmful links or links that clearly try to manipulate the search engine.
For example, your car repair shop receives backlinks in the footer of an Online Poker site.
They measure according to the profile of your links and website links that have been punished or banned from Google.
According to Moz itself, a Spam Score of up to 30% is considered low.
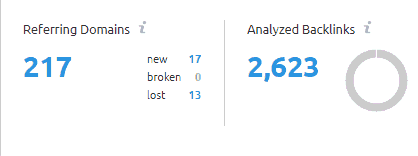
Other tools like Ahrefs and SEMrush show the health of your links and their quality:
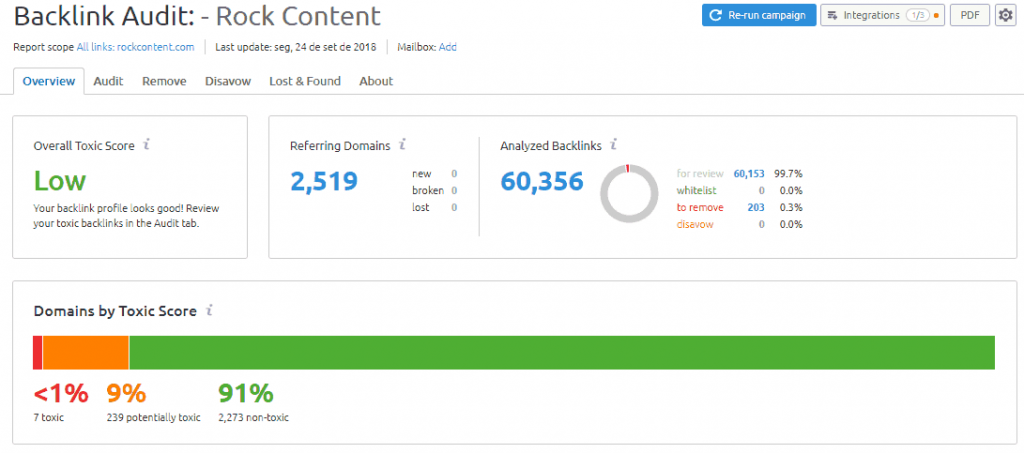
In this screenshot, we can see the number of backlinks received and the number of domains, but in this first moment we will focus on the “Toxic Score”.
Only 1% of links are considered harmful. Which is an excellent number and does not demand any kind of concern.
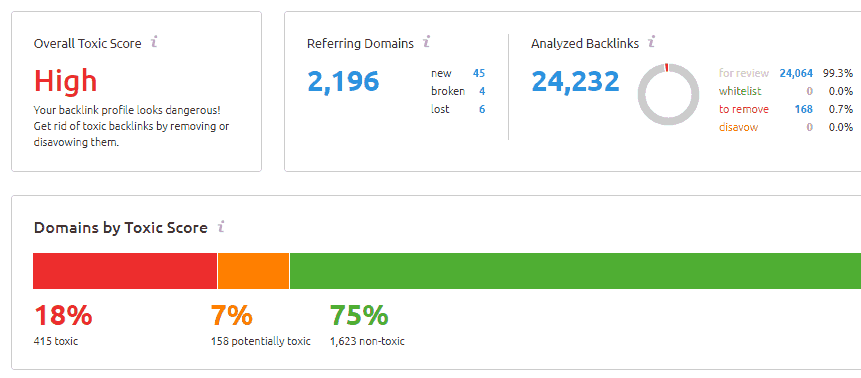
The problem is when your profile has a huge number of links considered toxic:
According to Google, you don’t have to worry so much about harmful links, because the search engine already identifies harmful links and ignores them.
There is some discussion with SEOs around the world about disavowing links (disabling links), some believe it is worthwhile, others do not.
My personal recommendation is that you check where these backlinks come from, if they are clearly harmful and spam domains, you can disable these links.
Google Search Console has a feature for this:
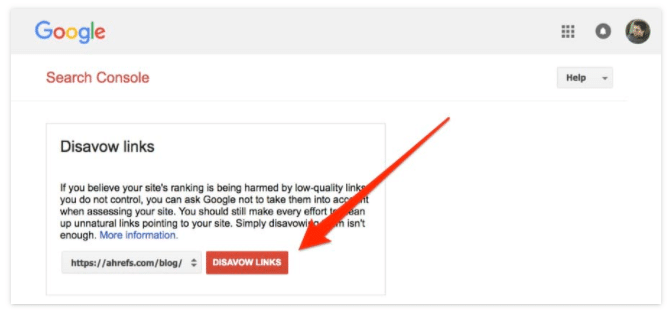
The most important thing when checking the health of your backlinks profile is to focus on getting more good quality backlinks for your blog, increasing the proportion of green links.
II. Quality of backlinks profile
With health assessed, it’s time to see if the amount of backlinks you receive is really of quality.
In addition, you need to keep track of the links you are losing or gaining.
Two of the main numbers are: the number of backlinks received and the number of domains.
That’s because it is much better to receive 5 links from two different good domains than 10 links from a single domain.
After all, the variety of domains shows Google that many different companies trust yours.
III. Quality links
It is also essential to look at what domains are linking to you in order to assess their quality. The characteristics of a good backlink are:
- Domains with good authority.
- Domains that are part of the same market as you (there is no point in receiving a link from an online poker site if you sell dog food).
- Links made in a natural way.
- Direct anchor text, or variation or similar to the main keyword (never “click here”).
- Link position on the page (the closer to the top, the better).
- New (unpublished) domains.
These tools also make it possible to see the anchor texts that receive the most links.
It also helps us understand if our link strategy is really bringing links to the right pages and anchors.
IV. Types of links
Another important feature is to see the types of backlinks we are receiving:
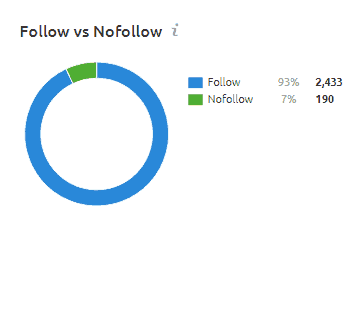
Receiving more follow links is the ideal scenario, but it is very important that you receive nofollow links as well. We generally tend to find this type of link bad, but they have several benefits:
- You receive traffic in the same way: they are normal links, receive traffic and clicks in the same way.
- Pass relevance: even if the link does not pass relevance like normal links, Google knows that the site is making a link to you.
- Social signals: links on social networks are nofollow and still have authority showing how the brand has public engagement.
- Increases brand awareness.
- Links generate more links: the more domains link to you, the greater the chances that others will also do it.
- More natural backlinks profile: if you only receive follow links, you can show an image of a forced and manipulated profile.
While considering these benefits, it is best that the priority of your strategy is to acquire normal links.
V. Competitor links
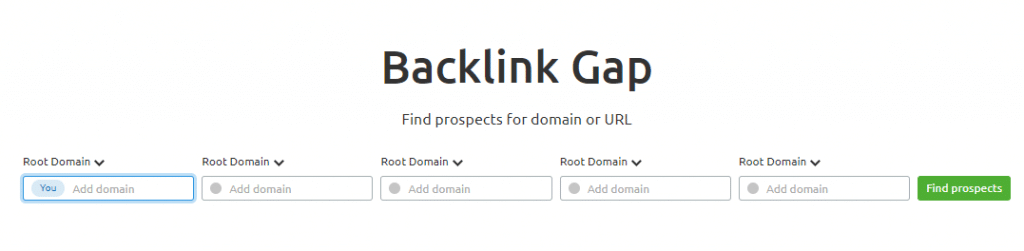
There’s nothing better to optimize your backlink profile than discovering the domains that link to your competitor and don’t link to you.
You solve two problems at once: first, you get links from new domains, second, you take a competitive advantage that your client had over you.
The screen below shows this functionality in SEMrush, highlighting the exclusive links for the compared domains.
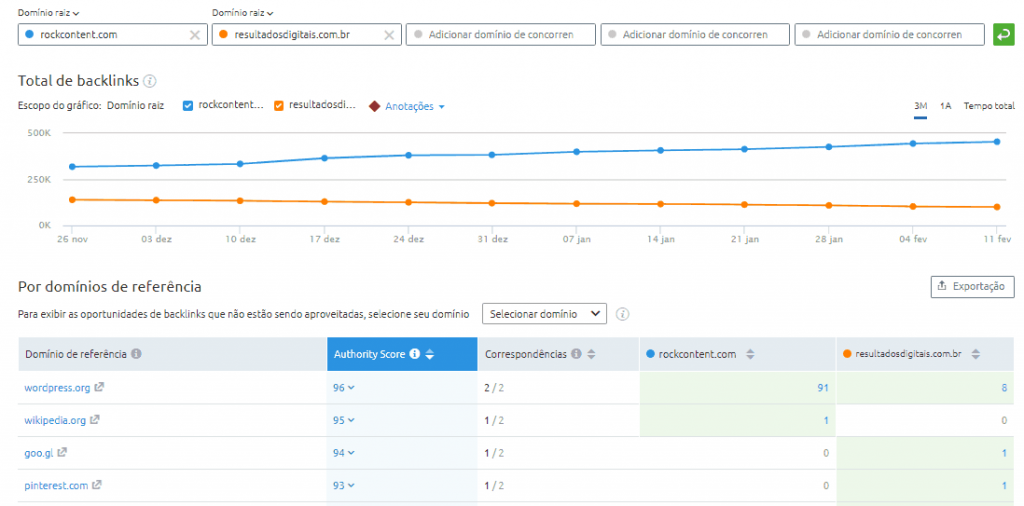
In addition, you have the ability of viewing not only the domain as a whole but specific pages and blog posts:
This analysis can present the best backlink opportunities for the strategy in the following month.
Another advantage is that you can see exactly where this link comes from (from a guest post, natural link, lists, etc.), facilitating a partnership proposal.
Backlinks Summary
Current moment:
- Backlinks profile (link quality, domain quality, quality of anchor texts)
- Pages and anchors that need more links
Next steps (insights)
- Get backlinks that my competitors have and I don’t
- Approach potential partners
- Apply new Link Building strategies
- Prospect partners that my competitors don’t have
Wrap Up
We’ve reached the end! And now, after all you’ve seen, you know what it takes to make SEO reports that generates insights:
- Understand the quality of your traffic and identify opportunities to increase traffic that bring real results.
- Follow the ranking of your top keywords and find new opportunities.
- Make sure that the content performs and generates good results.
- Monitor and take care of the site’s health.
- Understand and optimize the backlinks profile.
I hope these tips will help you create a report that will prove the results you have reached and show your strategy’s value. Furthermore, and mainly, may your reports generate real insights so your strategy never stops evolving and your SEO is continuously optimized.

![[ROCK NA] [EBOOK SEO] Complete Guide](https://rockcontent.com/wp-content/uploads/2024/06/banner_Search-Engine-Optimization.png)