Since U.S. intelligence and U.N. inspectors found evidence that the largest chemical weapons attack in 25 years occurred in Syria, the world has quickly divided over how to respond to this new information. While journalists and security experts have likened America’s decision to intervene in the conflict to operations in Iraq in 2003 or 1993, or the U.S. intervention in Kosovo, the growth of the internet, social media and the wealth of available public information on Syria means that Americans have access to more data about this conflict than any other. The importance of the information battle to both the Syrian regime and the Obama administration is indisputable. Along with his address laying out a case for attacking Syria, Secretary of State John Kerry released a brief report and map to reporters and the public detailing the administration’s case, citing sources as diverse as medical personnel and tweets from affected areas.

On its side, the Syrian Electronic Army brought down websites that enable anti-regime discussion and action, including Twitter, The New York Times and even The Onion. While the emotional medium of television, particularly American cable news, has steadily beat the drums for an attack, new media journalists have focused on different narratives from the Syrian conflict. Instead of asking questions like, “Should we intervene?” data desks around the world have spotlighted the underlying facts that form the basis for these important decisions. Al Jazeera has led the field in tracking events in Syria from the country’s initial uprising to its transition into potential target for an international bombing campaign. While many publications have come out with the standard maps of conflict and ethnic divides we have come to expect, Al Jazeera used graphics to tell more complex and less predictable stories. Its position as the only Middle Eastern journalism institution with a mainstream American audience has helped bridge the gap between the two regions with strong reporting and relatively user-friendly interactives. In one graphic, Al Jazeera tracked the various factions of rebel groups and political forces, and where they were active within Syria. Click on it, or any of the other graphics, to explore its interactive potential.

Another graphic shows the makeup of defectors from Syrian President Bashar al Assad’s regime. This is an example of how visualizing reports and bits of data from wire services can reveal new analysis and insight into a situation. While anyone following the Syria story heard about the defections, creating a network of these people by their profession and relationship to Assad shows deep divisions of loyalty within the Syrian government.
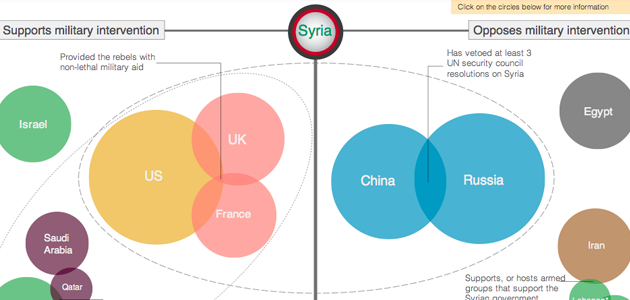
Surrounding talk about a military intervention has been the lingering question of where U.S. allies may stand if the country decides to attack. Instead of perpetuating the “with us or against us” binary so popular during the early years of the war on terror, this graphic shows the nuance of each individual country’s decision to get involved.

Now, as the U.S. moves military might into the region, Al Jazeera has also provided a graphical analysis of U.S. and Syrian military targets and capabilities, enriching what might otherwise be a rather boring text list or matrix.

Allison McCartney is an editor at the PBS NewsHour focused on education and informational graphics, and a freelance designer in the Visual.ly marketplace. She has a bachelor’s degree from Washington University in St. Louis, where she studied Middle Eastern history and art. You can follow her on Twitter @anmccartney.