What’s better: to do something quickly or do it well?
This question would raise an interesting discussion in any round of conversation. Still, the point of this article is to show that they are the same thing in many cases, especially when it comes to user experience in websites, blogs, and applications.
The page’s loading speed makes all the difference. It’s no coincidence that Google places so much importance on this factor when it comes to ranking pages in search results.
Even if your site has the ideal design for your persona and you’ve reviewed the content over a thousand times to ensure it’s clear and straightforward enough, your strategy will suffer if you don’t have lightweight, fast pages.
Fortunately, Google has created a tool called Google PageSpeed Insights, which helps you evaluate (and improve) a site’s loading speed.
Let’s learn more about how this feature works and why you need to start using it today to improve your website speed.
In this article, you will learn:
- What is Google PageSpeed Insights?
- What motivates a service like Google PageSpeed Insights?
- What happens to pages that take too long to load?
- How the Google PageSpeed Insights score works?
- How to use the Google PageSpeed Insights report?
- Why is it important to get a good score on PageSpeed Insights?
- How to achieve the highest score on PageSpeed Insights: 10 key factors
- Should PageSpeed be my only reference?
Download this post by entering your email below
What is Google PageSpeed Insights?
PageSpeed Insights, also known as PSI, is an online Google tool that evaluates the loading speed of a web page.

The evaluation separates performance score on mobile devices from performance on desktops and also offers practical suggestions for optimizing the speed of pages.
This makes PSI an intuitive and simple-to-use solution, not to mention it’s free. But some people don’t think it’s that relevant.
All the data gathered to offer these insights is collected via the Chrome User Experience Report, in which contains information about real world usage of the public web by Chrome users.
Understanding what motivates Google to create a feature like this can help you think differently.
What motivates a service like Google PageSpeed Insights?
Two little words you may already be tired of hearing — user experience — sum up Google’s work in defending and encouraging the creation of faster, lighter pages.
Nobody likes to wait too long to find the information they want in their browser. Think about your own experience: how many times have you been impatient when waiting for a page to load on your phone or even your computer?
If you stop to think about it, you will realize that most of the times this has happened, the big “delay” has been only a matter of seconds. So, if 1 second seems like a week to the user, slow sites negatively affect the navigation experience.
Google doesn’t want this, and neither do you. After all, bad experiences translate to less money on the table.
In fact, the last Google’s industry benchmarks for mobile page speed show that the majority of websites are way beyond perfect. And it’s happening across all industries.
That’s a good reason for Google to provide these metrics to the public, so everybody can see that is a lot of room for improvement.


What happens to pages that take too long to load?
Does it make such a difference to have a site that takes 1 second longer to load than the average? Absolutely!
Want to see the proof? A study by Kissmetrics on the subject revealed that 1-second delay results in 7% fewer conversions on a site.
As an example of this, if an e-commerce sells 100 thousand dollars a day, only 1 second more in loading the pages could cost up to 2.5 million in missed sales per year!
Sounds absurd? See the several ways in which the page loading time would affect your operation and your sales results.
Higher dropout rate
The same Kissmetrics survey, mentioned above, showed that online shoppers’ behavior is quite altered depending on the speed of the store they are in.
The study showed that no less than 40% of customers leave a site that takes more than 3s to load. Do you know what that means?
That if you have an e-commerce that takes 3.5s to load, you can waste almost half the traffic potential and lose a lot of sales.
Fewer conversions
Satisfied customer buys two, or three, or ten times. The fact is that if your customers don’t like the shopping experience, they are unlikely to return. And how does the loading time of the pages contribute to this?
A delay of 1 second (or 3s wait) reduces customer satisfaction by 16%!
As a complement to this insight, it is a great warning to know that 79% of customers who say they are dissatisfied with the site’s perceived performance will not shop on it again.
Lower organic traffic
Traffic is the origin of the commercial relationship. Without it, there is no purchase. And organic traffic is even more precious because it comes naturally and costs less to acquire than investing in ads.
And if you thought that, at least in this, website speed would not be a problem, you were wrong. Kissmetrics also showed that 44% of buyers tell their friends about a negative online experience.
In the same way that “word of mouth” can be of great help in getting qualified organic traffic, the opposite is also true: you can lose visits by creating a bad reputation in the persona’s eyes.
In a recent study by Backlinko, they found out that the page speed can have a significant impact on SERP rankings. Check out this video below where they show the research results.
Do you know what all the data presented here clearly shows?
That a seemingly insignificant fraction of time actually has a big influence on how your company will be perceived and the financial results it will achieve.
In other words, when it comes to doing business online, time is money, in a way that is truly staggering.

How the Google PageSpeed Insights score works?
The score your site receives when you type the URL into PSI is not random, nor could it be. You need to fully understand the analysis process to make it accurate and reliable.
So what criteria does Google use when determining which rating each web page should receive?
Basically, PageSpeed Insights does two things:
- analyzes the loading time of your page and how many resources it has (plugins, code scripts that communicate more often with the server and make the page take longer to load, etc.);
- compares this data with the average of all the pages analyzed.
After that comparison, PSI makes a simple but objective report that shows:
- what is the average loading time of the web pages;
- what is your pages’ loading time;
- their final page speed score;
- suggestions of ways to optimize your loading time.


And how does the grading work? It goes from 0 to 100 and it is defined when the algorithm compares the page with best practices (created by Google itself) to optimize performance score.
Finally, the grade is given based on how much room there is for improvement and optimization, i.e., how many recommended points you still need to apply.
Next to the numbered score, there’s a text ranking, which goes like this:
- good: score from 80;
- average: score between 60 and 79;
- bad: score from 0 to 59.

If you have any specific questions about how to use and analyze these numbers, Google provides a channel on Stack Overflow for users to address their doubts.
How to use the Google PageSpeed Insights report?
It’s very easy to use the PSI report. As we explained, just access the PageSpeed Insights link and type in your URL to see the result.
But then what? You need to act quickly to fix the errors and get better results. Just below the suggestions, there are links with the words “show how to fix”.
Once you click on them, you’ll see which files are slowing down the page and how to deal with them to reduce the time it takes the server to respond.

Receiving the diagnosis is simple and quick but only do it when you are ready to proceed with the “treatment” and optimize your site once and for all.
Why is it important to get a good score on PageSpeed Insights?
First and foremost, a good rating on PageSpeed Insights means that a site has a satisfactory SEO configuration.
That is because, just like Mobile Friendly and Mobile First, the loading speed on smartphones is one of the criteria most commented on by Google itself in recent years.
But the benefits go further! A site with agile pages contributes significantly to the user experience, which translates into lower bounce rates, longer visitor’s time on page, increased traffic, and growth in the number of leads.
However, in e-commerces, the effects are even more critical, as the sales and conversion rates, as well as the number of cart dropouts, are directly affected by this metric.
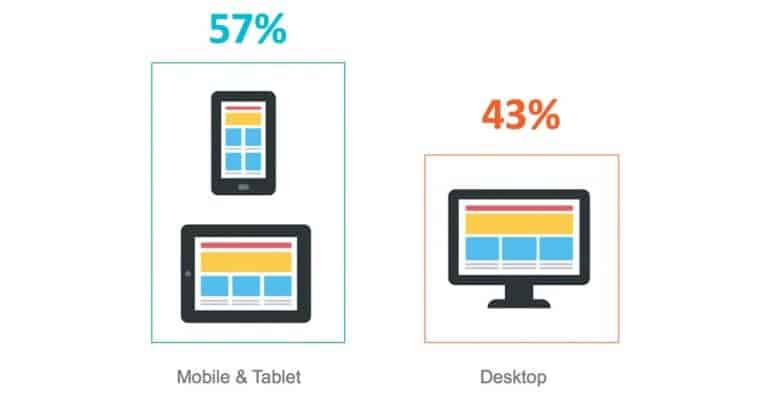
In 2012, a QuBit survey already showed that online retailing was losing about 1.73 billion pounds (almost 2.27 billion dollars) per year in global sales for this reason alone. Now, consider that over 57% of searches on the Internet come from mobile devices!
Another study worth checking out is the survey conducted by Walmart’s website to assess the impact of loading time on conversions. The results speak for themselves.
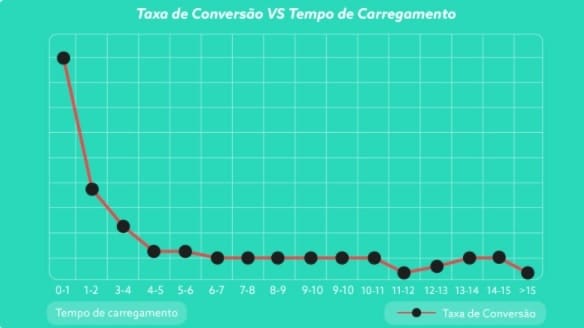
All of that changes our understanding of the consumer’s journey. If before the access to the Internet and shopping in online stores were restricted to residences, institutions, and lan houses, today, this happens all the time and in several places.
In addition, users’ familiarity with digital platforms, online sales, and transactions have also contributed to consumers becoming more sensitive to the quality and security of the websites they access.
In this sense, slow sites and especially checkout and payment pages with loading failures have never aroused so much distrust.
How to achieve the highest score on PageSpeed Insights: 10 key factors
You certainly have your eyes on the score of 100 — the highest score and one that guarantees a favorable look from the world’s largest search engine towards your page.
That’s great but to get the much-dreamed-of grade, it’s vital that you follow the report recommendations to the letter and optimize your site promptly.
As each site has a different situation, we’ll talk about 4 factors that most websites with good (but not great) grades need to improve and how you can do that.
1. Less HTML code
Optimizing HTML code can go unnoticed, especially if your site has been around for a while or has been built without following Google’s best practices.
The fact is that the way the code is organized determines how the servers will read the information and how long it will appear on the screen.
Duplicated code or tags used off purpose get in the way. Fortunately, there is no need to review the entire code structure to make the necessary changes.
There are HTML compression tools that can do this work automatically and quickly. Some of them even work as CMS plugins.
2. Good use of the cache
In PSI analysis, one of the main elements reviewed is the number of resources that the browser needs to assimilate from your page.
This includes images, scripts, fonts, etc. All of this can be “stored in memory” of the browser through the cache.
Thus, the browser will only load the elements once. Every time the user changes pages, the browser will only “remember” them and pull the necessary information from the cache.
But you need to optimize your site to make good use of this possibility.
Plugins such as W3 Total Cache, one of the most popular in the world, do this brilliantly and offer other features to optimize your code.
3. Resource compression
One of the most important elements in page loading is images, which makes compression one of PageSpeed Insights’ most recurrent recommendations.
Many people forget to compress images, which weigh a lot and slow down websites.
With the Internet becoming more and more visual, it’s common to have many files of this type. So, nothing better than using a good compressor to reduce the size of such files.
The same goes for CSS and Javascript. Together with HTML, they make up the whole page. So, it’s more than obvious that the compression of these files will make their perceived performance significantly better, as well as their overall PSI rating.
You can use free tools such as TinyPNG to compress the images before posting them on your blog.

4. AMP: Accelerated mobile pages
AMP (Accelerated Mobile Pages) is another initiative from Google itself to ensure that site pages load faster on mobile devices.
The idea is to offer a more basic mobile experience, without things that would work better in desktop versions. By taking away these unnecessary features, the website speed gets higher.
This makes it clear that it is better for the user to have a fast and straightforward experience than a full-featured version of the site, in which they would be forced to wait longer to see the content.

5. Reduced size of pages
Of course, the more resources a page contains, the heavier it will be, and the longer it will take to load.
In general, it’s the images and videos that contribute most to the weight of the pages. However, the total size of JavaScript and CSS files should also be considered. Let’s look at all this in parts.
6. Externally uploaded videos
If images make your pages heavy, imagine what a video doesn’t do with them, right?
Except in very special cases — such as very restricted platforms or content that requires a higher degree of security —, the recommendation is that your videos are always hosted externally, as we explained in the previous subtopic.
The most used media for this are YouTube and Vimeo, platforms that not only allow easy integration of their players in other sites but also help you promote your brand and improve search results.
If you provide restricted content, such as paid online courses, both media offer non-listing options, a feature that hides your video from searches and only allows access from a single link that you can attach — like HTML — within your pages.
7. Minimized JavaScript and CSS files
This is a less apparent problem, and probably that’s why it’s so neglected: the same SEMrush survey revealed that 68% of sites have non-minified JavaScript and CSS files.
Minimizing, as the term itself clarifies, means reducing or simplifying these codes, something that can be done by removing unnecessary lines, unnecessary comments, and blanks.
These files are behind the whole visualization of your site and are sometimes written with excesses to facilitate future editing. Also, they can be changed by various plugins.
But don’t worry, you don’t need to master any of these languages to perform this procedure. There are several tools that do it for you:
- Fast Velocity Minify;
- WP Super Minify;
- Online YUI Compressor.
However, remember to make a backup before using any of these solutions.
There will always be the possibility that the theme of your site or some file is affected by the procedure. Therefore, be cautious and be sure to do some testing.
8. Compressed files
Gzip is a web file compression format that acts as a real wildcard for those who fight for a good page speed score.
By compressing the CSS, JavaScript, and HTML files in your database, the size of your pages can be halved, if not more.
And since all today’s browsers are compatible with this feature, nothing changes for those who access the site.
Some servers already do this automatically — you can verify that your site has this type of service by testing your URL on the Varvy SEO Tool site. But if that’s not your case, you can leverage browser caching with plugins such as WP Fastest Cache, which offers this option.
9. Clean redirections
Often it’s not exactly the loading of the page that compromises the website speed but a sequence of redirections that forces browsers to load several pages in a minimum amount of time.
This problem is quite common in very large sites that have already made many address migrations — protocol changes (HTTPS, for example), duplicate pages (some with www, others not), category changes, URL structure, etc.
These redirections accumulate and make the link path to your pages longer and longer.
Therefore, try to keep your sitemap up to date, so that people can directly reach your site’s current addresses, and only implement redirections that are absolutely necessary — such as pages with important external links.
As for the others, delete them as soon as possible!
10. Improved server performance
This is a more notable problem in blogs, news channels, and e-commerces that receive a lot of traffic.
With the evolution of your project on the Internet, changes are necessary to maintain the pace of growth. One of them is your hosting plan.
In the situations mentioned, for example, it’s recommended to invest in a dedicated server capable of supporting a large number of simultaneous visitors, as well as reducing slowness and system outages.
Virtual stores that are not prepared for periods of greater demand — such as Black Friday or Christmas — are usually surprised by these basic problems.
However, there are other factors that may be compromising server performance, such as outdated software, slow database queries, memory limitations, and even local power management or computer cooling failures.
Therefore, be sure to activate the support of your hosting company in case the slowness of your site persists and always opt for renowned and well-referenced companies when hiring this type of service.
Should PageSpeed be my only reference?
You may have already come across pages mentioning minimum numbers for your evaluation on PageSpeed Insights.
Some say the ideal is to have a score above 95, others even say it’s essential to reach 100, at least on the desktop. Don’t get carried away by these generalizations!
There are many variables involved, and it’s not always interesting to give up certain features — such as monitoring, tracking, and conversion pixels — for a few milliseconds less when loading. Each case is unique.
Google stipulates that any score from 90 onwards is considered ideal, between 50 and 89 means the site needs basic adjustments, and only those below 50 indicate the need for critical repairs.
In addition, although page speed has the authority of the search giant, its tool has important limitations: the analysis is performed through a server with an unknown location, and mobile tests take as a parameter a 3G connection.
So, take page speed results as a reference but do not let its reports become an obsession.
An interesting tip is to test the site in other tools and compare the data from all of them. Check out some options below!
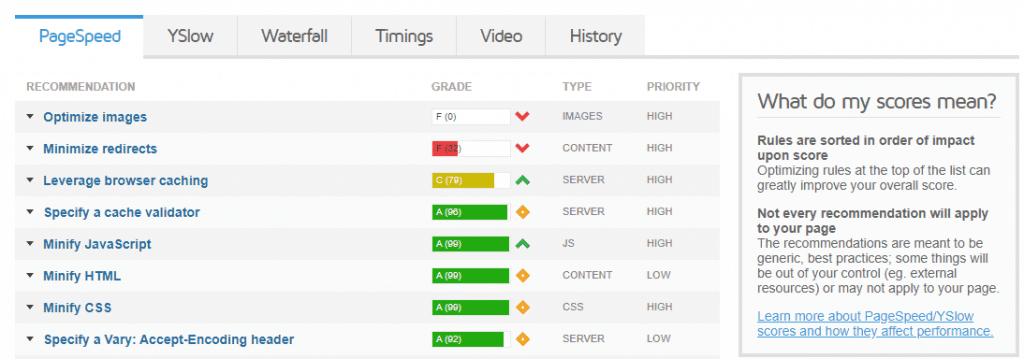
GTmetrix
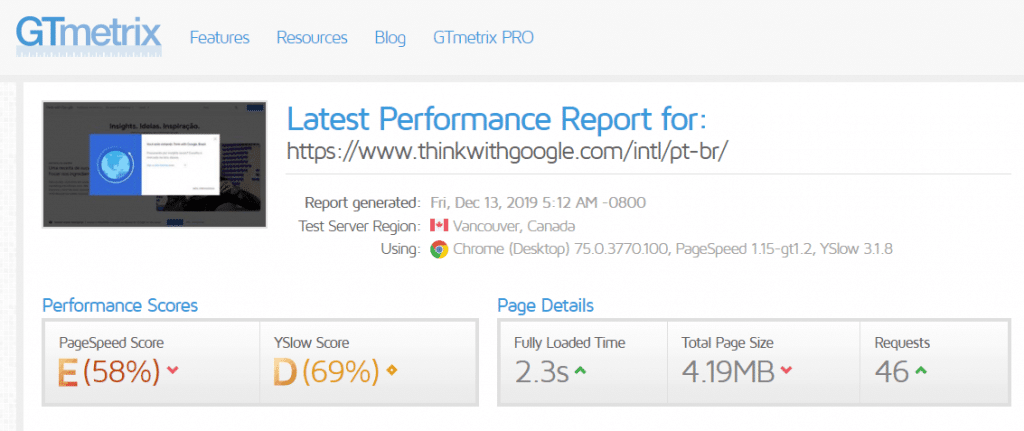
Its principle is the same as any other tool of its kind but with GTmetrix you can also compare the perceived performance score of your site with market averages in a totally free-of-charge environment.
Pingdom
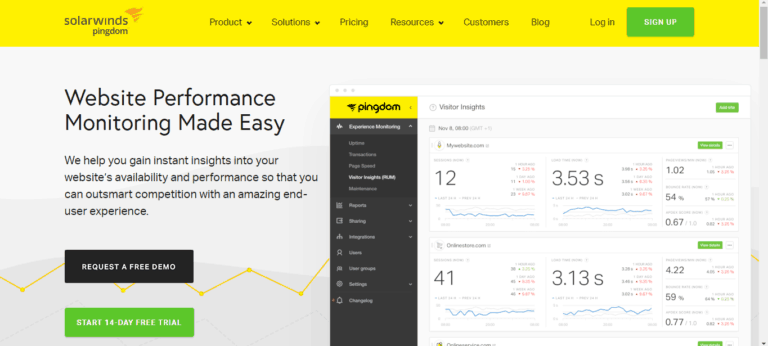
Pingdom is ideal for those who need more complete reports and are willing to pay for it.
Its analyses cross data from different parts of the world and its platform even sends alerts when a problem is detected.
Rock Stage Analyzer
For more refined analysis, our solution is Stage Analyzer, a complete performance evaluator designed to help you identify errors and growth opportunities on your site.

Stage Analyzer performs a complete scan of your site for configuration and URL errors, incorrect image scaling, as well as SEO failures and deficiencies, among other factors that may be compromising the user experience on your pages.
In just two minutes, you receive a handy list of recommendations to help you, step by step, provide the improvements your site needs. In fact, WordPress sites are most likely to have better performance scores.


All this with the quality and expertise that only the leading Content Marketing company in Latin America can offer.
As you could see, it’s important to get a good rating on Google’s PageSpeed Insights but this is just one of the many parameters we use to optimize and monitor the performance score of a site.
This article ends here but you can — and should — start providing improvements to your blog or web store right now.
Analyze your site’s performance with Rock Content’s Stage Analyzer and get a full SEO report to guide your strategy!


