The Real World: Data Visualization
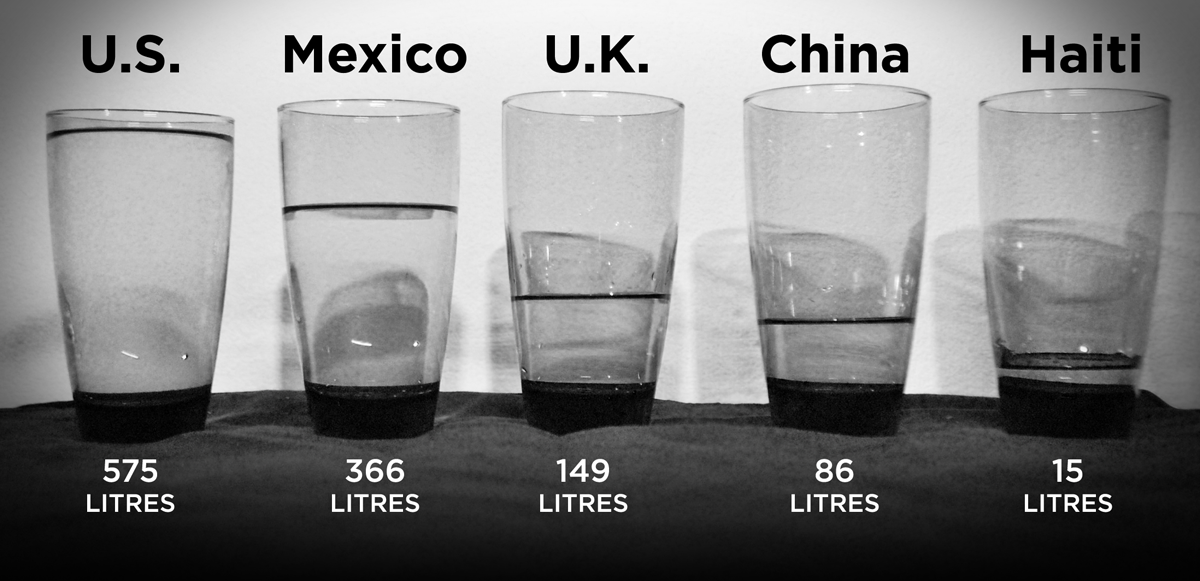
Real-world infographics, analog data visualization, physical visualization… there’s no official term for it yet,(...)
Real-world infographics, analog data visualization, physical visualization… there’s no official term for it yet,(...)
There are a lot of bad infographics out there. Some just don’t work with human perception and because of that, end(...)

What could be worse than a poorly designed infographic? A poorly sourced one. Too many infographics and data visualizati(...)
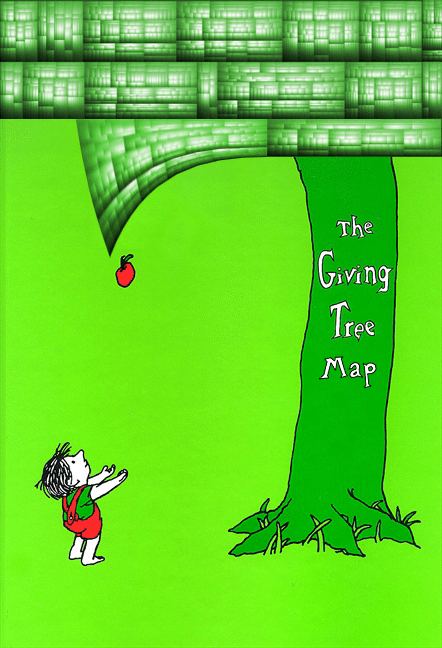
Treemaps have proliferated fast and far since Ben Shneiderman invented them in 1990. One reason for this quick spre(...)
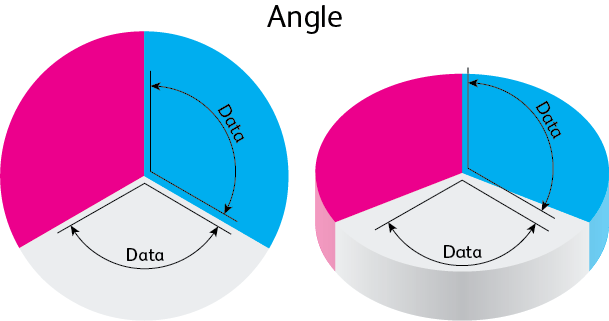
All your favorite things; Now in 3D! While this is a great tagline for movies and video games, visualizations work diffe(...)

Maroon. Chartreuse. Marigold. Cerulean. There are many colors to choose from when designing infographics and data visual(...)
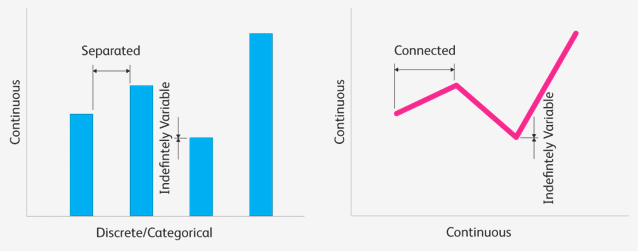
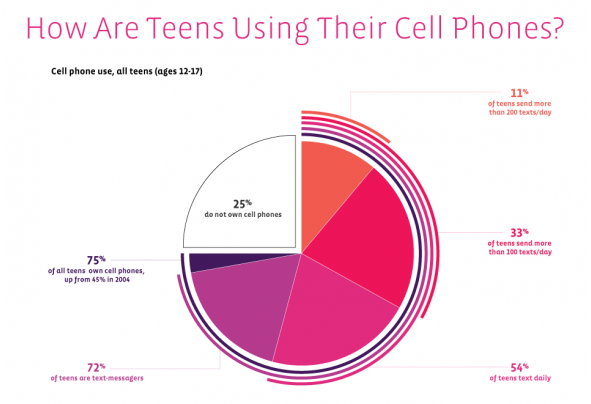
We all know visualizations can be a great way to represent data, but some visualizations are better than others at certa(...)
When Reuters closed its liveblog of the triple disaster in Japan after 14 days of live reporting, the resulting story wa(...)

The peacock is an impressive-looking bird and the weasel is a shrewd little predator. They certainly have their place in(...)