12 Great Visualizations That Made History
Most visualizations end up as passing follies that are significant in the short-term, but in the long-run they fade to t(...)
We use cookies to help you navigate efficiently and perform certain functions. You will find detailed information about all cookies under each consent category below.
The cookies that are categorized as "Necessary" are stored on your browser as they are essential for enabling the basic functionalities of the site. ...
Necessary cookies are required to enable the basic features of this site, such as providing secure log-in or adjusting your consent preferences. These cookies do not store any personally identifiable data.
Functional cookies help perform certain functionalities like sharing the content of the website on social media platforms, collecting feedback, and other third-party features.
Analytical cookies are used to understand how visitors interact with the website. These cookies help provide information on metrics such as the number of visitors, bounce rate, traffic source, etc.
Performance cookies are used to understand and analyze the key performance indexes of the website which helps in delivering a better user experience for the visitors.
Advertisement cookies are used to provide visitors with customized advertisements based on the pages you visited previously and to analyze the effectiveness of the ad campaigns.
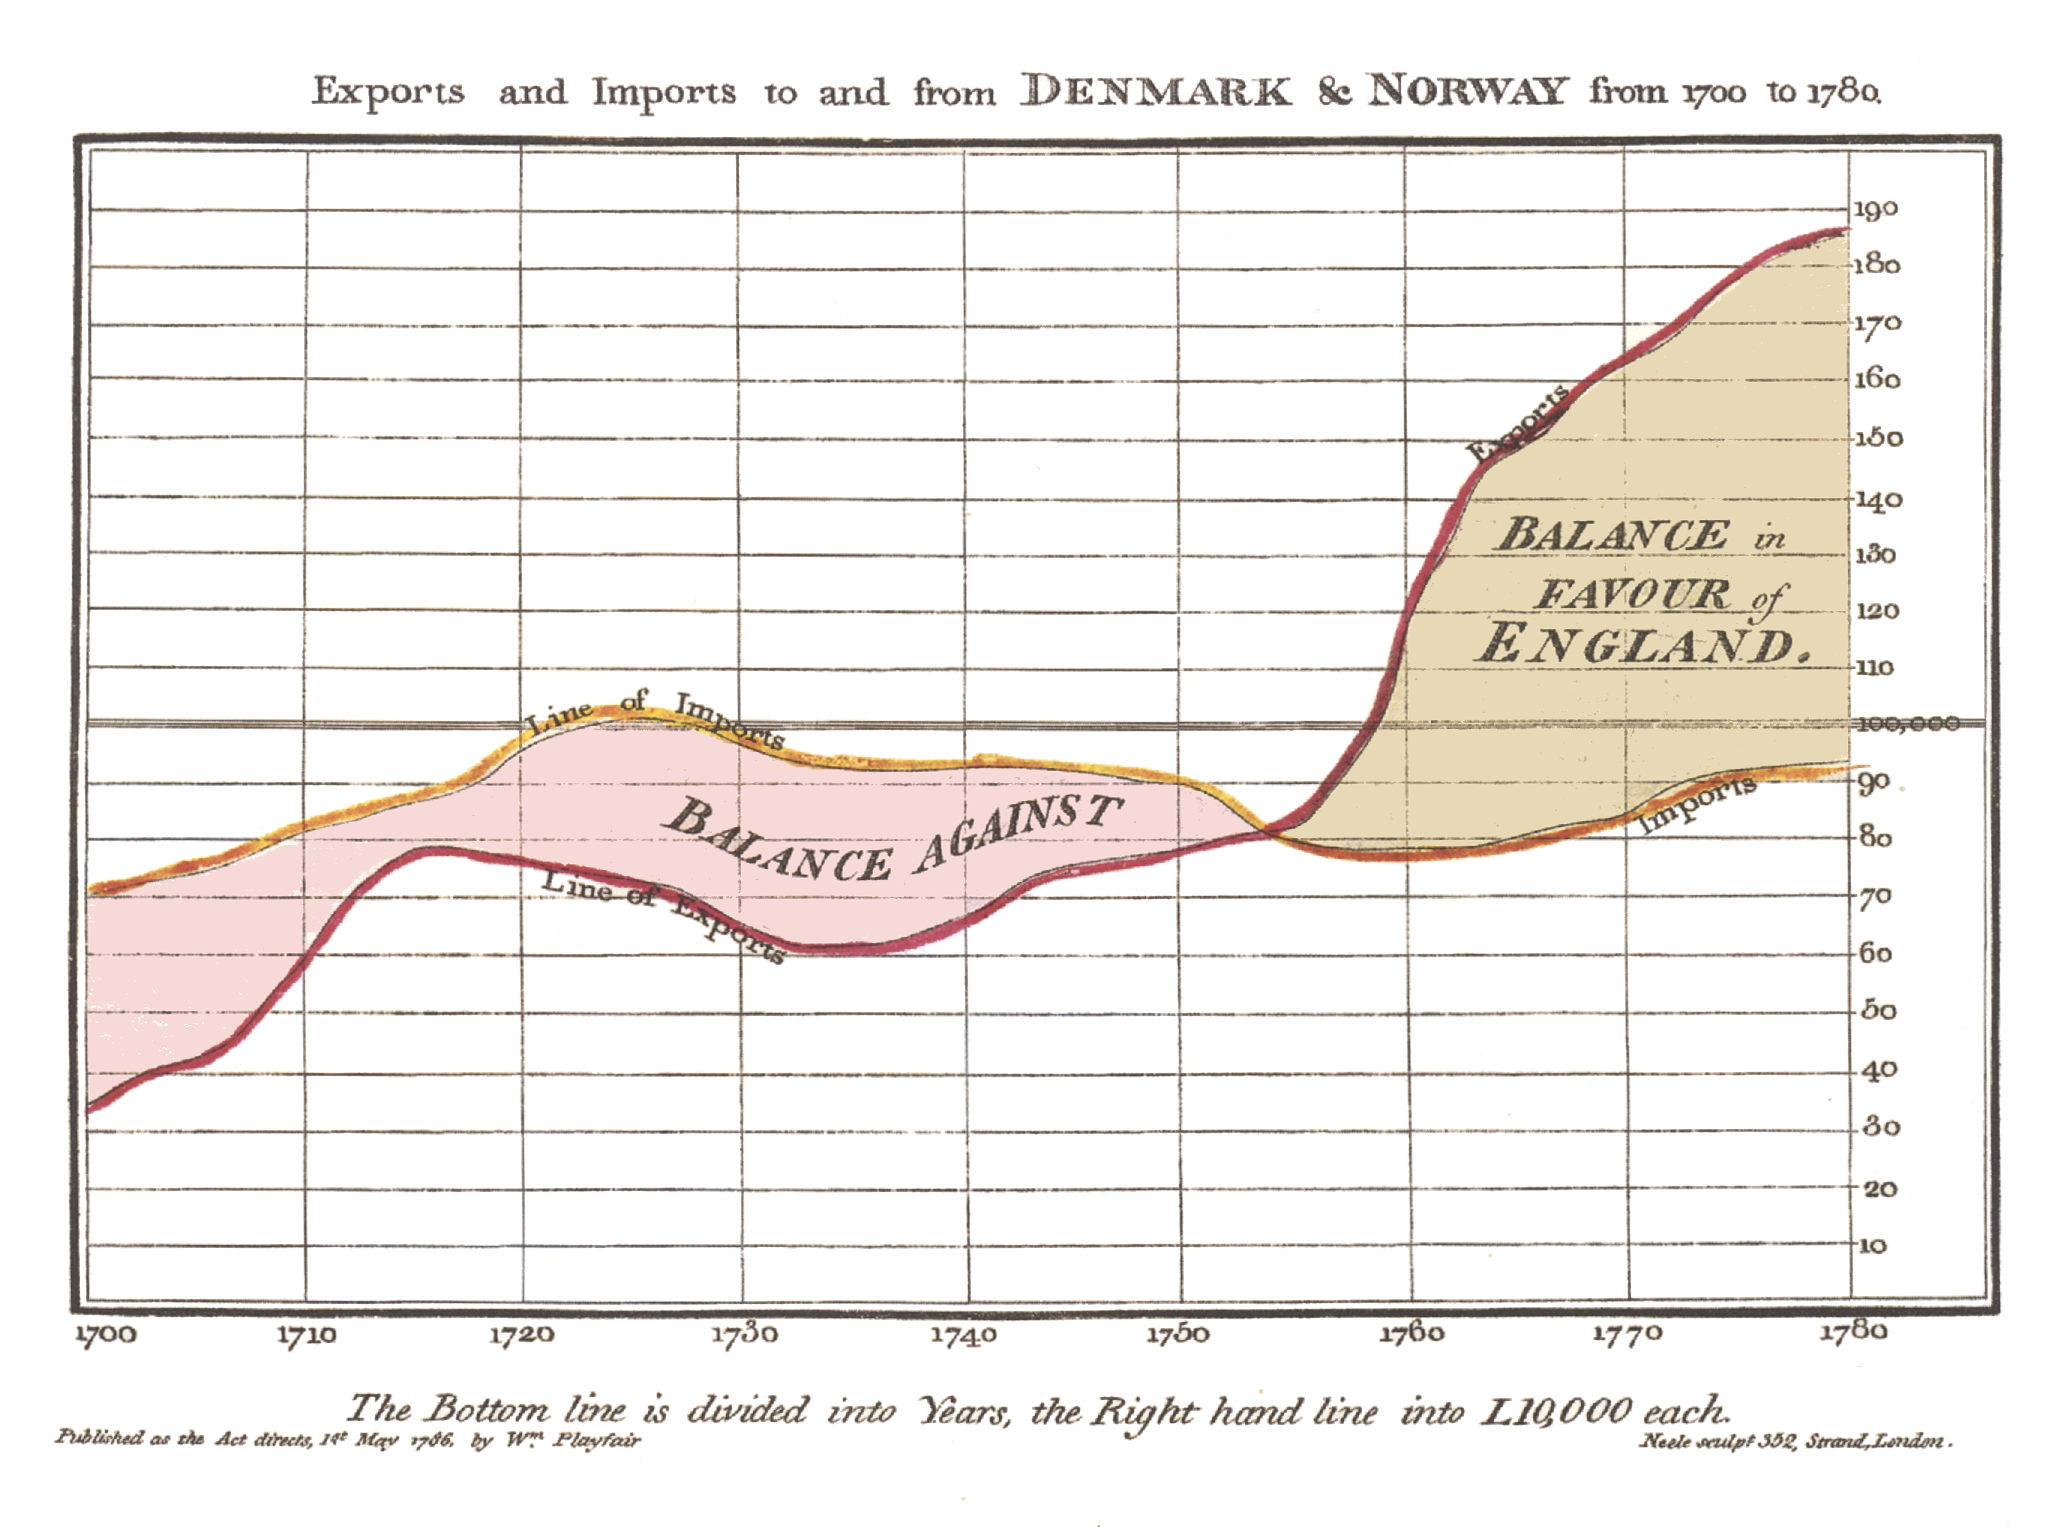
Most visualizations end up as passing follies that are significant in the short-term, but in the long-run they fade to t(...)
What makes a good information visualization piece? Not even the experts agree. Despite sharing a common goal – to crea(...)
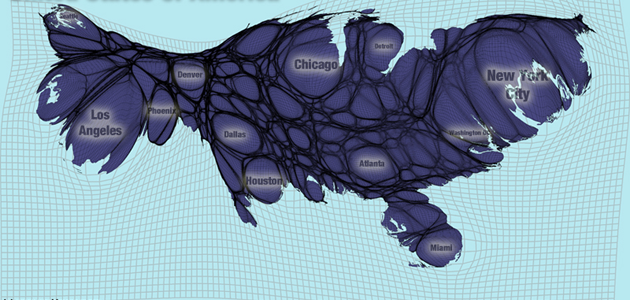
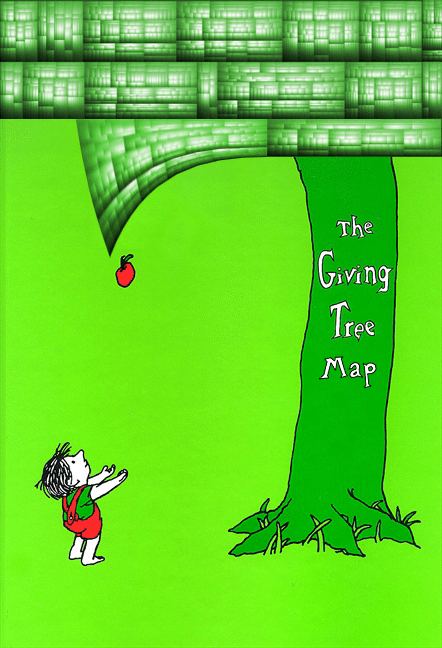
Maps are probably the biggest subsection of visualization types. There are many variations on map types, each with its o(...)
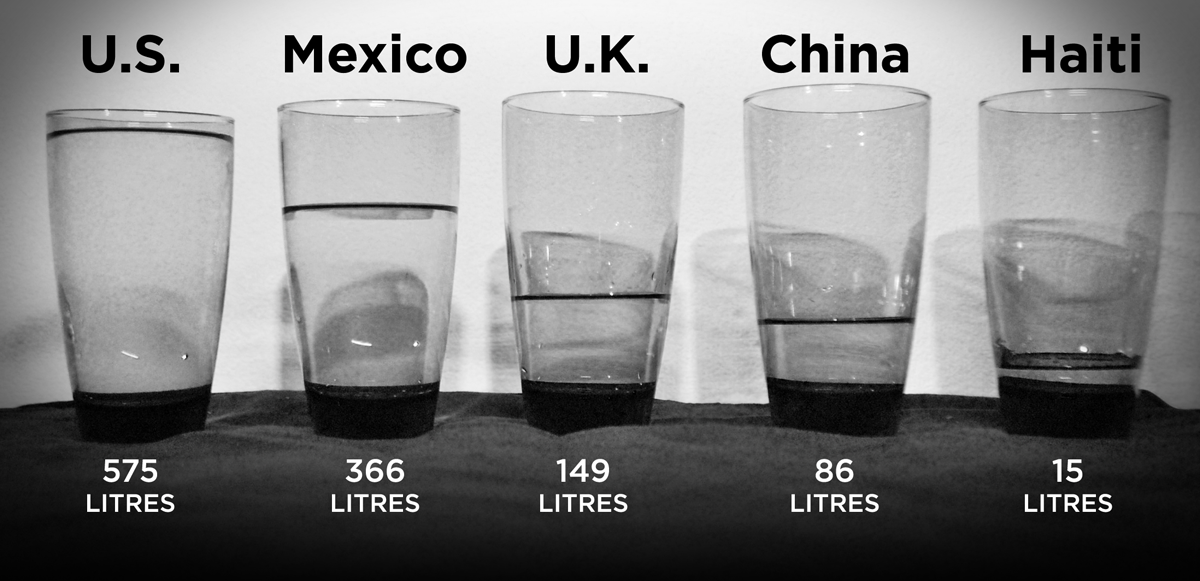
Real-world infographics, analog data visualization, physical visualization… there’s no official term for it yet,(...)
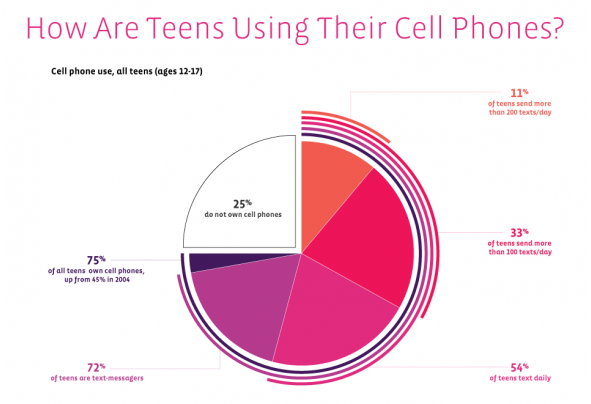
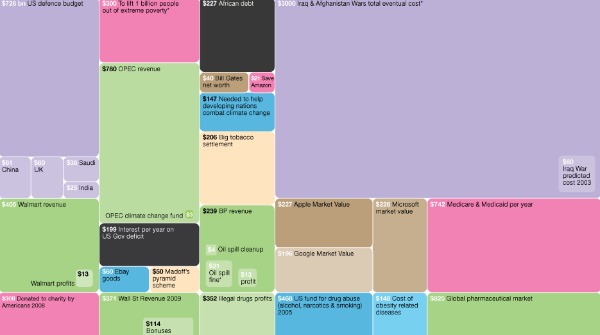
There are a lot of bad infographics out there. Some just don’t work with human perception and because of that, end(...)

What could be worse than a poorly designed infographic? A poorly sourced one. Too many infographics and data visualizati(...)
Treemaps have proliferated fast and far since Ben Shneiderman invented them in 1990. One reason for this quick spre(...)
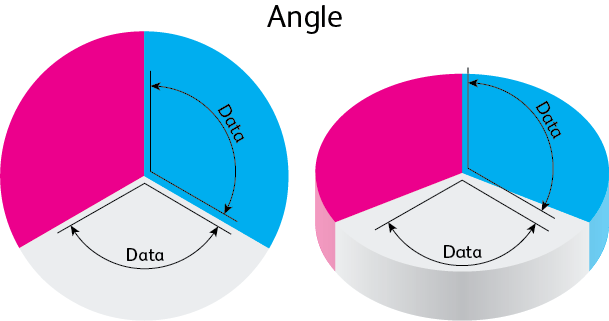
All your favorite things; Now in 3D! While this is a great tagline for movies and video games, visualizations work diffe(...)

Maroon. Chartreuse. Marigold. Cerulean. There are many colors to choose from when designing infographics and data visual(...)